
February 2018 Newsletter
Too Much to Get Through in Just 28 Days!

Dear Subscriber,
Well closing out that March SPY put option last week actually gained us about 75% on the whoosh down at the open last Friday...and earnings season has us with new/close to 52-week highs in Micron, Applied Materials, AMD (buy out rumors today!), Lam Research (with $25 per share earnings estimate for fiscal 2020...OMG), ASML, NVDA, and on and on.
With our put and call option profits and most positions up/ flat/slightly down (ex OLED and AAOI) or paying dividends, while the overall market is flat for the year we are still up 12% as of March 7 including closed positions.
Action to Take: PUT A SELL STOP ORDER at $120 on OLED. We may get a bounce here...but I hung on too long to OLED...it bounded off its 200-day nicely and got back over its 50-day in February...all GOOD. Then they announced the slow down in orders from Samsung ...a lull...with orders to pick up later 2018/2019. Let's let the market keep us in on bargain hunting or take us out with a 120% profit from our entry in 2016.
IF we get taken out...I will relook at it in July. Samsung obviously has too much OLED screen inventory with 50% LESS orders from Apple X...and Samsung's new S9 OLED phone is off to slow sales. Key point: $900-$1200 price point for a smartphone device is a LIMITED addressable market.
Action to Take: SELL AAOI OH do I wish I sold when it spiked and ramped to $108! I did NOT follow my rule like we did in selling Imping and AMBA on spikes to unsupportable valuations. We'll take the 50% loss from original buy price and still be ahead on OLED profits...but the 100G laser market vanished in the first quarter and we missed the turn. The 400G upgrade cycle gets going later this year...and we still follow the hyper-data center space closely.
Right now our direct plays on the global hyper-data center build out are AMD and NVDA...but Intel and Microsoft are leading contenders to add to our buy list for a number of reasons (I will spare you from this right now...but if you OWN INTC and MSFT...HOLD THEM as their data center business is now 25% CAGR grower that is making a difference!).
Now the important part of the newsletter: What are the economic realities TODAY and for the next 6-9 months that are STILL pushing up the earnings of our investments FASTER than their valuations and the market as a whole?
Our Known Market & Economic Knowns March 7, 2018
In economics, things take longer to happen than you think they will, and then they happen faster than you thought they could.”
– Rudiger Dornbusch
I waited on the “February” newsletter to get a look at the fall-out of the economically insane proposed steel and aluminum tariffs. With the resignation of Gary Cohn…I am reminded of this chart from the 2002 Bush steel tariffs that imploded the market.

I am also reminded of the chart comparing the fast market start of JFK with his promise of cutting personal tax rates from 90% highest marginal rate to 45%:

I am NOT saying we are sitting on the edge of a new bear market....but the correlations are pretty freaky. NO...the best way to get your head around where we are in the real economy and the market for stocks is to just lay out the facts… the known knowns…and the known unknowns.With these arrayed, we update 9-12-month investment thesis.
1) Transformity Macro-Market Index: 18.6…virtually ZERO risk of a recession in next 4-6 months (UNLESS a global trade war starts and I will comment on that risk later). 2.95% GDP Q1.
2) Atlanta Fed “Nowcast” 1Q 2018 GDP Latest forecast: 2.8 percent —NY Fed Nowcast 3.1%
The GDPNow model estimate for real GDP growth (seasonally adjusted annual rate) in the first quarter of 2018 is 2.8 percent on March 7, down from 3.5 percent on March 1. The nowcasts of first-quarter real consumer spending growth and first-quarter real nonresidential equipment investment growth declined from 2.9 percent and 10.1 percent, respectively, to 2.6 percent and 6.9 percent, respectively, after the light vehicle sales release from the U.S. Bureau of Economic Analysis on March 2. The nowcast of the contribution of net exports to first-quarter real GDP growth declined from -0.43 percentage points to -0.59 percentage points after this morning's international trade release from the U.S. Census Bureau.

3) 2018 S&P 500 Revenue & Earnings Per Share Are Insane for This Late in Business Cycle
The Tax Cut and Jobs Act’s (TCJA) cut in the corporate statutory tax rate at the end of 2017 will send earnings hurtling beyond the Earth’s gravitational pull this year and into outer space...especially for our technology and financials (FINU) players.


It’s conceivable that some of last year’s earnings extravaganza was attributable to the Trump administration’s easing of regulatory costs. More likely is 2017 earnings were boosted by the synchronized global economic expansion that followed the worldwide energy-led global growth recession from 2014 through 2016. We started to see signs of a global recovery during the summer of 2016, which led me to conclude that stock prices were likely to head higher in a meltup. Earnings were on course to be great in any event, and now they will be even greater thanks to the TCJA.
The flash crash a few weeks ago might have given the bears a reason for living, but it was too short-lived. The “Flash Crash of 2018” was a MARKETevent, notan economic event. The correction did what it had to do: It blew up the easy money gravy train of selling volatility insurance (when you sell a put option against the VIX you are in the volatility insurance business) and it exposed who was naked when the tide went out (the market was at higher percent at 1.7% of market value on margin than 2000).
And here’s another disappointing flash for the bears: The operating profit margin of the S&P 500 rose to a new record high during Q4. It was 11.0% based on Thomson Reuters data and 10.4% based on S&P data. It will
Profit margin. Remember all the perma-bears telling us " the bull market was on a FED QE induced sugar high and that earnings would be disappointing, or that profit margins would soon revert to its mean." Well WRONG and WRONG.
At the end of February, the analysts’ consensus earnings estimate for 2018 was actually $157.92, a 19.1% y/y gain. I am currently forecasting $155.00, a 16.8% increase. In any event, earnings will be up HUGEly this year. You can thank the GOP for now. When we see the $2 trillion in new deficit spending already locked and loaded...we can then BLAME them.
Earnings. S&P 500 operating earnings per share jumped 15.3% y/y during Q4-2017 according to Thomson Reuters. S&P also compiles operating earnings for the S&P 500 operating earnings using a more conservative approach for one-time nonoperating gains and losses. This measure rose even more impressively, with a 22.3% y/y gain. The four-quarter sum of S&P 500 operating earnings per share (based on the Thomson Reuters data) was $133 last year. The forward earnings series suggested in late February that earnings are headed toward $160 per share this year. That would be a 20% jump.
The Transformity MacroMarket index of 45 real-time economic indicators confirms this data. On the other hand, the trade-weighted dollar fell 7.0% y/y last year, which boosted revenues. As I previously noted, the dollar tends to be weak when the global economy is doing well and commodity prices are generally rising.
Revenues. S&P 500 revenues rose to a record high of $329.41 per share at the end of last year. Remarkably, revenues per share rose 9.4% y/y, the fastest since Q3-2011. Needless to say, it’s hard to imagine that this fast pace was boosted by anything that can be traced to the White House, especially since almost half of S&P 500 revenues come from abroad. In the US, nominal GDP (not inflation adjusted) was up 4.4% y/y during Q4, lagging the 8.5% growth in S&P 500 aggregate revenues. In short, the big cap 500 stocks are OUTGROWING the overall US Economy by 2x...and OUR stocks earnings and revenues are outgrowing by 10-20X!
We now have the results for S&P 500 earnings during Q4-2017. They were HUGE. Consider the following: The destruction of the Volatility trade that caused over $200 billion in stocks to be cashiered/margin sold led me to conclude that the meltdown in the stock market in early February was indeed a flash-crash market event correction that would be short-lived. Given the January meltup, it was due and was NOT a call on actual and expected earnings which now ARE higher during Q1-2018 thanks to the TCJA.
What IS most important?: Our AVERAGE operating company EPS growth in 2017 is 34%--operating profit margin 22%---THIS is why our Transformity Investor portfolio is killing the S&P 500 for the 5th year in a row. Thank God most investors don't see the Global Digital BPA ("Business Process Automation") Transformation aka the Industrial Cloud/5G Internet 3.0 IS the driving force in virtually every country.
What am I talking about? In essence--what is Amazon? It's the worlds first self-contained Digital BPA "Stack" : 1) Direct to Consumer and Direct to Business DIGITAL INTERFACE via 2) The Ubiquitous Enterprise Cloud (AWS) and Wireless Broadband 3) Global Long Haul & Last Mile Logistics powered by 4) Ubiquitous Business Process Automation (BPA) and/or Business Process Outsourcing ("BPO").
The BPA/BPO Platformity Principle: If you are in an industry still with legacy distribution and inefficient retail and wholesale sales channels...you are TOAST unless you rapidly "Amazonize" your company and build your OWN Cloud-based Digital BPA/BPO stack. More on this in a bit...but the ONE area we have made big money in recently is Shopify--and they are a BPA-as-a-Service stack for small business. One stock I was waiting to pull the trigger on was the Chinese Shopify Baozun who I regret today not adding last week now that they finally gave the quarter I expected (BZUN). We will get some on pull back...but they are 1/20th the market cap of Shopify.
The bears could make a comeback if El Trumpedo turns into an outright protectionist. He has been a protectionist rabble-rouser for 3 decades...but now that he sees the stock market damage he will pull back. In fact, he already DID blink and walk back steel tariffs for Canada and Mexico this morning...and other allies in the afternoon. And SOMEONE has to have shown him how the WTO humiliated #43 when W tried the same global tariffs in 2002--the market is pricing that in as well. My GOP economist pal Douglas Holtz-Eakin said this morning on Twitter: "IF you don't want to blow up the world economy why are you threatening it with matches?"
I'm with my old friend economist Ed Yardeni as he postulated last week: “Could today’s sharp stock market selloff on news that Trump intends to slap tariffs on steel and aluminum imports be the incipient formation of the Dow Vigilantes?” Trump clearly prefers the Dow Jones Industrial Average as a measure of his popularity rather than opinion polls--at 35% approval who wouldn't?
And now the GOP has FINALLY decided out of ALL the 2 dozen or more conservative heresies committed by #45 during his campaign and presidency...THIS ONE...tariffs on trade..TRADE TARIFFS ARE THE LINE in the sand! What would it take for Republicans to turn against Donald Trump?
Now, finally, we know. For nearly three years, Republican lawmakers have stood with Trump through all manner of outrage. He called Mexican immigrants murders and rapists. Videotaped boasts about casually sexually assaulting various women. TWO Playboy and Adult film ladies with $300,000+ in payoffs for long time affairs while married to Melania. Alleging that his predecessor put a wiretap on him. Falsely claiming massive voter fraud. Racism directed at a federal judge. The firing of James B. Comey. Talk of women bleeding. A defense of white supremacists in Charlottesville. Support for Senate candidate Roy Moore despite allegations of child molestation. The guilty pleas of staff members and advisors Michael Flynn, George Papadopoulos and Rick Gates and the indictment of Paul Manafort. The botched travel ban and bungled repeal of Obamacare. Insulting Britain and other allies. Attacks on the FBI and judiciary and attempts to fire the attorney general. Talk of African “shithole” countries. The lethargic hurricane response in Puerto Rico. The stream of staff firings and resignations and personal and ethical scandals, most recently Tuesday’s finding that Kellyanne Conway twice violated the Hatch Act
But NOW Trump has at last gone too far? He has proposed tariffs on foreign steel and aluminum. And the Republican Party is in an all-out revolt!.
(PS the funny thing here is how his protectionist anti-trade rhetoric is EXACTLY like Hillary Clinton on trade...but I digress).
So now we know. Look for the WTO threat and watered-down "tariffs" to blow over just like Stormy Daniels and the Playboy model...pardon the pun.
4) It's the Inverted Yield Curve Stupid! We NOW have proof: An inverted yield curve remains a powerful signal of a looming recession and that is still the case even if the current ultra-low level of U.S. interest rates are taken into account, according to fresh research by the Federal Reserve Bank of San Francisco. 9-for-9 time, a negative curve, where the return to investors on shorter-dated securities is above that on longer-term bonds, has predicted all nine U.S. recessions since 1955, with a lag of six to 24 months.

The findings, published Monday in the San Francisco Fed’s regular Economic Letter, show that the term spread, or the difference between short- and long-term interest rates, is as good today as it’s always been at spotting problems ahead. But there’s no urgency just yet. While relatively flat, the current yield curve doesn’t signal a high risk of a downturn even though the U.S. economic expansion is already the third longest on record.
“Forecasting future economic developments is a tricky business, but the term spread has a strikingly accurate record for forecasting recessions,” study authors Michael Bauer and Thomas Mertens, who are both economists at the San Francisco Fed, wrote in their analysis. “While the current environment appears unique compared with recent economic history, statistical evidence suggests that the signal in the term spread is not diminished. An extensive analysis of various models leads us to conclude that the term spread is by far the most reliable predictor of recessions.”
I've updated our Transformity Macro Market Indicator with the yield curve heavily weighted. We have called EVERY bear market since 1986...we will NOT MISS the next one trust me. We WILL have hopefully 2 or more corrections BEFORE we blow the whistle on this bull market.
5) How Important Are Stock Buybacks to this bull market? INCREDIBLY Important! Between 2007 and 2016, companies in the S&P 500 spent 54% of their profits on stock buybacks. More than 40% of total EPS growth between 2009 and mid-2017 is from share repurchases, according to estimates by Christopher Cole, who runs a hedge fund called Artemis Capital Management that I follow.
How important are stock buybacks to our 2018 market? Incredibly important. S&P 500 companies will buy back a record $800 billion of their own shares in 2018, funded by savings on tax, strong earnings and the repatriation of cash held overseas, J.P. Morgan said Friday. That will far exceed the $530 billion in share buyback that was recorded in 2017, analysts led by Dubravko Lakos-Bujas wrote in a note. Companies have already announced $151 billion of buybacks in the year to date. “There is room for further upside to our buyback estimates if companies increase gross payout ratios to levels similar to late last cycle when companies returned >100% of profits to shareholders (vs. 83% now),” said the note. “Corporates tend to accelerate buyback programs during market selloffs.”
Key Point: The overall stock market has been supported by stock buybacks. since 2010 Share buybacks have accounted for +40% of the total earnings-per-share growth since 2009, and an astounding +72% of the earnings growth since 2012, compared to +24% organig. Since 2009, an estimated +30% of the stock market gains are attributable to share buybacks.
REALLY Key Point: Without share buybacks, the S&P500 index would currently trade at an expensive 27x earnings. Artemis Capital, October 2017
7) Earnings Fundamentals are Historic: A record 78% of S&P 500 companies have beaten analysts’ revenue estimates so far for the fourth quarter of 2017, and overall earnings growth is nearly 15% y-o-y, which would make it the best quarter since 2011, according to FactSet.
Key point: yet OUR portfolio was UP today…which means we are still in the sweet spot of the overall indexes. When does this bond rate cycle end? It ends when it ends is the honest answer. When the algo’s are not making money selling stocks at >2.9% 10 year and buying below 2.8%...it ends. Or until Q2 earnings season kicks in.
8) The leadership of 2017…Information Technology is STILL leading the stock market in 2018 for the same reason we have been investing in it since 2013: The world is only 2-3 years into the THIRD giant10 year secular technology transformation from the Consumer Internet 1.0 to wireless mobile internet 2.0 to now Industrial/ BPA Internet 3.0.
The Industrial Internet 3.0 enables consumer and business digital services delivered from apps in the public hyper cloud and wireless 2 gig broadband via 5G wireless and the Internet of Things (iOT) comprised of trillions of sensors Global cloud based digital Business Process Automation (“BPA”) platforms enable the collapse of the final layer of intermediaries between the product or service creator and the business or individual consumer (in other words direct-to-consumer and direct-to-producer).
The information-technology sector of the S&P 500 Index surged 37% last year, almost double the advance of the benchmark index. It has done the same this year too. Driven by strong financial performance, the tech sector is currently trading at a modest price-to-earnings ratio premium to the S&P 500 SPX, +1.18% When the sector dropped 10.6% from Jan. 26 through Feb. 8 — in line with increased volatility in the S&P 500 — it rebounded almost 9% in the following week as investors’ focus shifted back to fundamentals.
Dominant Digital BPA and BPO Platforms are Dominating the 21st Century Digital Economy—we will add a few before next earning season. Our favored transformational sectors are 4-5 YEAR secular growth sectors regardless of overall GDP growth and continue to outperform the overall market 3-to-1.
9) Fed Chairman Powell flunked his first outing. He changed the word “balanced” from his prepared remarks in his Q&A. He SURE as hell will get it right on his Thursday sit-down with the Senate. It's not that Powell said anything particularly surprising. He noted that the economy is growing faster, and that he is more confident that inflation will hit the central bank's 2% inflation target. But the market sure acted as it had been taken by surprise, didn't it?
But his tone--which we talked about earlier--appeared to be more hawkish than Yellen, writes Amherst Pierpont Securities Chief Economist Stephen Stanley. "I have said all along that Chairman Powell would not be a Yellen clone but would instead be much more down the middle of the hawk-dove spectrum," he explains. "Today, the markets seem to have begun to figure that out."
The cognitive dissonance today was “If you don’t KNOW if the tax cuts are going to over stimulate the US economy, don’t SAY anything.” Stocks are priced for 3 .25 basis point rate hikes March, June and December—there was a 25% chance of a 4th— now a 32%. Stocks are STILL priced by discounting future earnings against inflation and perceived volatility (in other words do I like the stock well enough to hold on/buy more in 2-5% downturns). At a 16 VIX the market has priced in 1% volatility range for S&P 500 index—that seems about right.
10) Watch for Wage Inflation to Come Back from the January Blip. Investors who apparently were not alive in the inflation days of the 70’s and early 80’s freaked out over the fear that this specter of inflation would prompt the Federal Reserve to raise interest rates more aggressively than just 3 gradual 25 basis points
I believe these fears are way premature. The lesson of the past half-century is that inflation doesn’t appear suddenly. It took years for the Great Inflation of the 1970s to get started—and, of course, years to end it. But it was the product of unique circumstances that have few parallels today. That’s why everybody should just chill and not get carried away with inflation fears, which have led far too many pundits off the deep end--me included!
When I dug into the data from the years before the Great Inflation emerged, I found that inflation remained quiescent even after the great economic boom of the 1960s got underway. The table below shows that CPI rose by less than 3% in almost all the years from 1956 until 1966.
Roots of the Great Inflation
GDP growth and inflation in the 1960s & 1970s

CPI indexed to 1982-84=100
Sources: U.S. Commerce Department Bureau of Economic Analysis (BEA), Federal Reserve Banks of Minneapolis and St. Louis
That occurred despite a robust economy: Annual GDP growth topped 6% in four years that decade. That suggests this economy can tolerate much higher GDP growth before it overheats. And guess what? Real economists are forecasting long-term GDP growth below the 3%-forever projections of the Trump administration.
Look at the recent data. GDP hasn’t grown by 3% in a single year since 2010, and inflation topped 3% only in 2011, a clear outlier. Since the end of the financial crisis, CPI rose by more than 2% only twice.
Where's inflation now?

CPI indexed to 1982-84=100
Sources: U.S. Commerce Department Bureau of Economic Analysis (BEA), Federal Reserve Banks of Minneapolis and St. Louis
What does this tell us? First, we have a long way to go until inflation is a real threat again. Also, the inflation of the 1970s was unique. A booming economy encouraged strong unions to win cost-of-living increases that pushed wages higher. President Lyndon B. Johnson’s Great Society social programs and big escalation of the Vietnam War poured fiscal fuel onto the fire. The Fed ignored the early signs of inflation in the 1960s, and by the next decade Fed chair Arthur Burns was pressured by President Nixon to cut interest rates to make sure he got re-elected in 1972.
And then there were two big spikes in inflation in 1973 after the Arab oil embargo and in 1979, following the Iranian revolution. Fed chair Paul Volcker killed inflation by pushing the federal-funds rate up to an astonishing 19.1% in 1981. The price of that was a deep recession in 1981-82, but it started a disinflationary period that lasted more than 35 years.
I see very few parallels today. The Fed under Jerome Powell is committed to raising rates and shrinking its balance sheet over time. With a federal-funds rate of 1.25% to 1.5%, it has plenty of room to hike before it hurts the economy. Wages have recovered a bit but remain depressed because of globalization and technology.
The only real threat I see, short of a geopolitical black swan, is the fiscal mess a reckless Republican Congress and president have created with their big tax cuts and spending programs at a time the economy needs it least. Over time that may cause higher inflation and interest rates, but I don’t see a repeat of the 1970s.
Final Point: I wanted to get through most of Q1 earnings to make a call on our portfolio. We are through and in 90% of our positions they are delivering as promised.
We ARE going to add 4-5 BPA Platformity Leaders in the next weeks. They are NOT cheap...but because they are mostly subscription model companies their revenues and operating leverage are VERY sticky with very high incremental profits and renewal subscriptions.
Biggest worry here? We have a "Tale of Two Cities" stock market post February Flash Crash. The leadership of the market is VERY thin-- it's Mega Cap Tech & FANG..Semiconductor and Storage Tech--BPA Platformity and BPA-as-a-Service and Financials. WHEN we add our BPA Platformity we will be in all the leading sectors and subsectors.
BUT...look at the overall market WAY under the 50-day moving averages...they HAVE to catch up
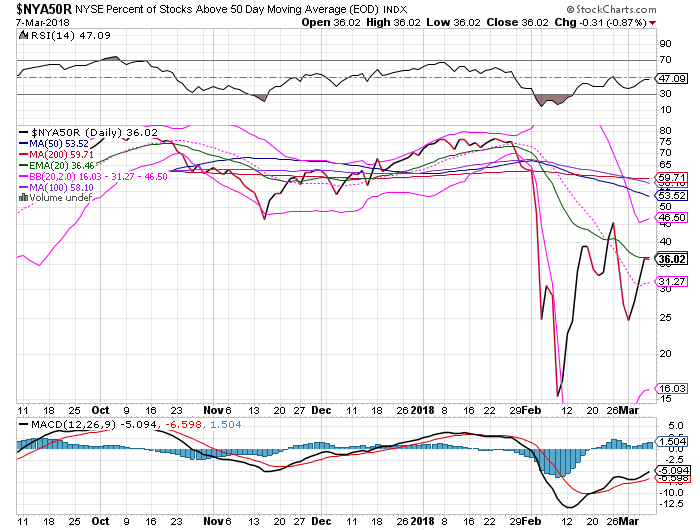
Compare this performance to Technology. Now...if you look at ALL our data points above, this leadership makes total sense because of the Global Business Process Automation Platformity & Enabling Technology STACK is getting by FAR the most CAPEX from global companies...and that was BEFORE corporate tax cuts! Our Valuations WILL continue higher especially in low p/e equipment players...but in the next correction...we usually get them every 6 months or so...OUR leaders will become the dreaded "sources of cash" trade.
LOOK AT THE DIFFERENCE in OUR stocks over 50-day vs. overall market!

Solution: We are going to Continue to put cash to work in the Global BPA Stack...and some unique opportunites...and quietly take profits in higher risk plays and use options to capture BPA profits into the summer. We have to be tactial and strategic...and we have our strategy down.
This way we are prepared for the NEXT correction as interest rates slowly rise which means volatility will rise--risk assets need to be priced vs. no risk assets. When no risk assets like 10-year bond gets to 3.25-3.5% yields...IF the OVERALL stock market growth and dividends are not 2-3X higher, money is going to shift to 10-year bonds.
#2 Strategy? We will add some internatinoal BPA/BPO plays as well selling at much lower valuations.
#3 Strategy? We WILL but calls on the VIX and puts on TQQQ and QQQ AGAIN if they do NOT break out from the January tops...which they are darn close to! Look at the XLK Tech Index...mounting a charge to break out from its January top...

Here are the Semiconductors...she is close too! (is that sexist?):

and the Nasdaq 100...same image! The XLK and QQQ are either TRIPLE Tops or break outs...

But the Semis and Software are much healthier double tops...and software and internet platform stocks have just broken out!

The Internet Platforms have broken out leading the way!

ALL we need is the Financials to get back to their 2018 peak and join the party...that will be cobined 40% of the S&P 500...and enough to carry the market higher while our key Super Sectors soar 3-8X higher!

Individual Stocks and new Buy Unders and Targets NEXT...
Please let us know if you or your subscribers have run into any issues with the new website! If so, contact: Msmith@nbtgroupinc.com (301) 520-9610
- Toby
Copyright © 2018 Transformity Media, Inc., All rights reserved.
Our mailing address is:
38689 North 104th Place Scottsdale AZ 85262
(301) 520-9610
tsmith@tranformityresearch.com
