
January 2016 Newsletter
Happy New Year . . .eh sorta.
Sitting in 95% cash at this point FEELS great on big down days. The Bears are in firm control of the wildly gyrating market with numerous boogey men scaring traders and underperforming hedge funds. Selling the market melt-up rips in the last few weeks has been the strategy: sell first and ask questions later.
Key Point: You and I know the ONLY way to make MONEY in 2016 is going to depend on us buying the leading sector leveraged ETFs and GARP (Growth at a Reasonable Price) stocks when it FEELS the worst.
I'll get into where we are in this latest bull market correction in this 7 year expansion. But the ONLY way we do NOT make money in this volatile market is if we have entered a real bear market where all melt-down rips should be not be bought...and melt-up rips should be sold.
At this point we are in a cyclical bear market with the average stock down 23% from the market high in May. In most ways the extremely oversold market indicators are flashing "meltup" to hit any day.
Perhaps most oversold here is Apple down 26% from its May high . . .more on that in a moment.
We need to connect the dots on HOW the market puked up ALL its Q4 gains in 7 trading days because buried within the these correction causation"dots" is the way to understand when the fear reaches its climax and ALL the shareholders who HAVE to sell liquid positions HAVE sold . . .aka a tradeable cyclical bottom.
The 2016 Correction/Cyclical Bear Market in a Nutshell
Zero Conviction, China out of Control and Zero Leadership. The most recent correction in stocks . . .Dec 30-Jan 11 2016 . . .has been driven by a GANG of threatening events. We have to take each fearful event separately and understand them to have confidence in a tradable bottom in what now is a cyclical bear market within a secular bull market.
#1 Are we in a secular US stock market Bear Market? No but I will say the odds are growing. The overall market ex-Top 10 Nasdaq 100/SP 500 stocks has been in a bear market since late July 2015. Our NBTI Macro Market is still positive 15.6 with deteriorating manufacturing output 3 months in a row (aka strong dollar) and positive services output and job growth. Our indicator is pricing pretty weak earnings growth year-over-year and pretty weak forward guidance.
The Atlanta Fed's GDPNow Q4 2015 forecast for just 0.8% of REAL GDP growth (nominal growth minus inflation).

Now let's look at the GDP growth trend as measured by the Chicago Fed aka the CFNAI
The Chicago Fed's National Activity Index (CFNAI) is a monthly indicator designed to gauge overall economic activity and related inflationary pressure. It is a composite of 85 monthly indicators as explained in this background PDF file on the Chicago Fed's website. The index is constructed so a zero value for the index indicates that the national economy is expanding at its historical trend rate of growth of 2.2%. Negative values indicate below-average growth, and positive values indicate above-average growth.
The first chart below shows the recent behavior of the index since 2007. The red dots show the indicator itself, which is quite noisy, together with the 3-month moving average (CFNAI-MA3), which is what we use as the true indicator of the actual trend for coincident economic activity.
For a broad historical context, here is the complete CFNAI historical series dating from March 1967.
The next chart highlights the -0.7 level. The Chicago Fed explains:
When the CFNAI-MA3 value moves below -0.70 following a period of economic expansion, there is an increasing likelihood that a recession has begun. Conversely, when the CFNAI-MA3 value moves above -0.70 following a period of economic contraction, there is an increasing likelihood that a recession has ended.
The next chart highlights the -0.70 level and the value of the CFNAI-MA3 at the start of the seven recession that during the timeframe of this indicator. The 1973-75 event was an outlier because of the rapid rise of inflation following the 1973 Oil Embargo. As for the other six, we see that all but one started when the CFNAI-MA3 was above the -0.70 level.
The next chart includes an overlay of GDP, which reinforces the accuracy of the CFNAI as an indicator of coincident economic activity. The bad weather First Quarters of the last few years bounced back with Q2 surges back to trend.
Key Point: The U.S. Economy is NOT YET at risk of recession
i.e., two consecutive quarters of negative growth. Secular Bear Markets that occur without an economic recession happen because of financial bubble bursting (2000 and 2007) or global economic shocks like the oil embargo in early 70's.
Which brings us to the RISKs to the US bull market and the US economy OUTSIDE the U.S. and YES this list starts with China, its currency vs. US dollar, and how both affect demand and price of WTI/Brent crude oil.
We Need to Beware Markets that do NOT Rally on Good Economic News
I am always leery when good news fails to rally markets as would be expected with the strong employment report for December or the decline of oil prices in the face of heightened Middle East tensions.
Last week we saw huge negative movements in Chinese markets and a large foreign market response. Here are my biggest worries from China: 1) Unsustainable Financial Services growth 2) Mass Over building of infrastructure 3) $400 BILLION of capital flight out of the country in the last few months which leads to 10-15% MORE devaluation of their RMB currency.
First Worry: Over the past year, about 20 percent of China’s growth as reported in its official statistics has come from its financial-services sector, which has mushroomed to the point where it is about as large relative to national GDP as in Britain. At the same time Chinese debt levels have reached MANY multiples of its $10 trillion economy...like 5-8 times. In addition, a majority of earnings on its risky Shenzhen stock market in 2015 came from...trading stocks!
Key Point: When real operating cash earnings do not drive stocks . . . this is NOT sustainable growth. Most of China's public companies are in the industrial or real estate construction/development industries thus the "conversion to a consumption driven economy" from a public securities standpoint is decades away (yet the service/consumer industries ARE the only parts of the China economy left with 10 percent growth).
Secondly, we all know China’s growth has come heavily from massive infrastructure investment; indeed, China put in place more cement and concrete between 2011 and 2013 than the United States did in the whole of the 20th century. This growth, too, is obviously unsustainable, and even if it is replaced by domestic services it will take another decade to make up for the GDP contraction from lower exports and internal infrastructure construction.
Key Point: The 10 year commodity "Super Cycle" died in 2012/2013 . . and China’s contribution as the marginal/final bid for global commodities now reverses for the next 12-20 years as excess infrastructure and real estate is slowly absorbed or abandoned.
Finally I can tell you the simple but best indicator of a country’s near term economic prospects are the decisions that its citizens make about keeping capital at home or exporting it abroad. The reason the renminbi is under pressure is that Chinese citizens are selling their RMB and moving $trillions by moving RMB money overseas SAFETY by all sorts of legal and illegal ways.
Key Point: We learned this week that if NOT for the substantial recent depletion of China’s dollar reserves, the renminbi would already have substantially depreciated.
IF the renminbi (aka the Yuan) is actually allowed to depreciate against the dollar at the rate it is now falling we will see another 10-15% decline. That is an all out currency war (look to the Euro going <$1 and Yen down 10%+ too) and THEN we have a toxic economic brew for stocks:
- $WTI/Brent Oil at $20-$25 as the rise in US dollar (oil trades in $dollars) of 10%+ Higher KILLS Oil and oil patch death spiral bankruptcies explode in North America
- With $20-$25 oil Arab Sovereign Wealth Funds with $3 trillion+ of liquid stocks and bonds will HAVE to liquidate $200-$300 billion of their most liquid stocks and bonds to stop the gaping holes in their budgets. If they don't they face another Arab Spring revolt on their hands. With Iran and Saudi Arabia now suspending government relations over the Saudi executions of an important Iranian cleric, PRIDE will keep their oil spigots wide open and with Iran adding 500,000 more barrels of oil to the 2 million per day of oversupply from relaxed economic sanctions, they will raise ALL the money they have to keep their citizens from revolt
- Deflation accelerates in the United States/Europe/Japan as $20 oil and Chinese export prices down 15% means China is exporting MORE global deflation than Central Banks can harness with inflationary monetary policy That deflation drives long term interest rates DOWN (and prices up). With the Fed in the process of "normalizing" monetary policy and short term interest rates RISING we risk an inverted bond market (it's called the "inverted yield curve" as short term interest rates exceed 10-year Treasuries). History shows us THAT yield curve inversion means a recession is coming 100% of the time.
- A REAL economic recession means a REAL Bear Market.
- S&P 500 earnings (with 40% of revenues in foreign currencies) drop down another 10% ish from currency losses and EPS estimates are taken down.
- Emerging Market economies driven by commodity exports to China continue to contract as stronger dollar makes their exports worth less and $trillions borrowed with dollar denominated debt grow every larger vs. commodity derived GDP. A EM debt crisis combined with China slow down (China plus EM countries now 58% of world GDP) presents an Emerging Market contagion to developed economies and $trillions in bad debt needs to be written down.
Worse?
There is NO FED or ECB to ride in to save the day for the stock market by drastically cutting short term interest rates!
In the good old days of Fed policy (before rise of China starting 2000 and EM was just 35% of world GDP) international economic developments had only a limited impact on the U.S. and European economies because their negative impacts could be offset by Central Bank monetary policy actions. Thus, the U.S. economy for instance grew robustly through the late 90's Asian financial crisis as the Fed brought interest rates down.
Today? With rates essentially at zero or NEGATIVE in the 45% of GDP from North America/Europe/Japan and developed countries, the good ol Fed or ECB riding to the rescue with 3-4% interest rate cuts ain't there to save the day this time.
Really Key Point: in 2016 the power of economic contagion from #2 GDP China and Emerging Market Economies is now serious and powerfully affects US and European economic performance in a way our Central Banks are helpless to mitigate.
THAT is why the capital markets FREAK OUT when capital gushes out of China and Fed is RAISING short term interest rates while RMB devalues. It's a toxic brew of lower RMB, stronger $US dollar and rears Central Banks and equity investors worse fear: global deflation or stagnation.
The Good News? Charts Tell The Story Well: We are DAYS away from a Melt-Up Oversold Rally
Let's go to the charts and see exactly where we are in this correction process and bear market melt-up short covering rallies.
#1 WE are just two days of back to back GOOD earnings reports from a 6-10% melt-up scenario based on how oversold ALL the market indexes are ex-oil.
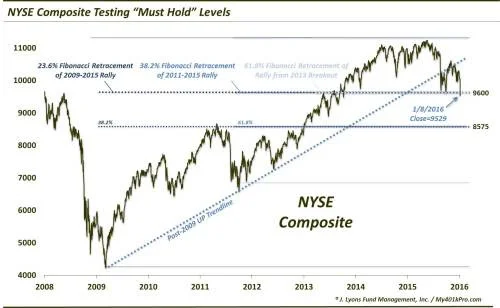
The entire NYSE Composite is at must hold levels technically.
Nasdaq Composite. We are about 130 points away from full retest of Aug/Sept lows . . .and relative strength is below 30--with momentum stochastics just about to turn UP!
The Comp is 300 points BELOW its 200-day moving average and PRIMED for a melt-up bounce on ANY strong back-to-back earnings days.

The S&P 500 is only FIVE points away from retest of Aug/Sept lows.

The ENTIRE market as measured by the Wilshire 5000 is BELOW the Aug/September lows and 2000 points below 200-day moving averages.

The Nasdaq 100 is down 7 trading days in a row and 200 points below its 20-day average and 200 points away from its Aug/Sept bottom

US Microcaps are completely annihilated and MASSIVELY oversold

Small Cap Russell 2000 is below Aug/Sept lows and massively oversold too.

Our beloved Biotechs are annihilated as well: The are SO oversold we may buy a March Option at 320 for a TRADE.

Our beloved Biotechs are annihilated as well: The are SO oversold we may buy a March Option at 320 for a TRADE.
Key Points: WE HAVE to expect a powerful correction rally soon UNLESS early earnings and forward guidance are truly ugly in the NEXT FEW DAYS.
Really Key Point: STAY tuned for BUY UPDATES in your Email at close of trading.
ALL we are missing is some BIG down volume for a flush out of remaining bulls and then a turbocharged short covering rally will hit like a tornado. China is a wild card here: NOT their stock market but their currency. Oil prices have to stabilize as well: We dropped below the key $32 support I was looking to hit. Now it has to hold $32 or we make the run to $28

Final Point: Until we get the key averages OVER their 50-day moving averages we HAVE to treat ANY moves we make as TRADES and not investments.
Bear market rallies are VERY sharp because of panic buying of shorts who don't want to lose hard earned profits.
The Wild Cards
The US Dollar against a trade weighted index of Euro/Yen/RMB is back near the top of Feb 2015

The US Dollar vs. Euro is back to under its 200-day average of $1.11. $1.05 is the key support for sure.

Summary: We are at the mercy of earnings news over the next few weeks.
IF we get the QQQs, Biotech and SP 500 to show capitulation volume we can make very nice profits on snap back rallies.
We will HOLD Micron (MU) and Newtek (NEWT) for dividends and insurance if a melt-up hits when not expected.
We have been at these market junctures MANY times in the last 3 years...and three corrections in the last 6 months!
What the market has going for it at this point is:
- Mass hatred
- Earnings expectations lowered and hated
- MAYBE Apple gets a bid here--it still drives the QQQ and S&P 500 Indexes
We HAVE to take what we can get here . . .be patient and let the market mechanics of oversold and overbought momentum to give us the opportunities to make our 25% goal in 2016.
OPEN our email updates ASAP and look for them at close of the markets.
- Toby
Copyright © 2016 Transformity Media, Inc., All rights reserved.