
TR SPECIAL Report 2H 2002 Part I: The Fed's TINA/Buy-The Dip/ EVERYTHING BUBBLE ERA Is DEAD But Nasdaq Bear Market Is NOT!

A Transformity Research Special Report
Here's How You Get Rich (or Stay Rich) Following
Transformity Investing's "FOMO-to-OH NO!"
2022 BEAR MARKET Survival PLAYBOOK Parts 1 & 2
The good news first.
We just proved YOU CAN STILL crush today’s Negative SP500/QQQ Index Fund Returns by 5-10X In Today's 1) "DeRussiafied” 2)“DEFedified” and 3) “RE-InFLATEified” stock market in 2022 as the economy heads into a certain 2023 recession.
This Transformity Research Special Report Series 2022-2023 comes to you in three parts:
PART IA: Tired of Watching Your Retirement Security Melt Down? WAKE UP—The Fed’s Everything BUBBLE Party Was Declared Dead in December 2021
Key Point: The Fed’s SP 500 “RUG PULL” Liquidation Phase of High P/E “Growth-At-Any-Price” Stocks Has Another 20%+ LOWER to Go and Nasdaq 100 the Real Potential for Another -30%+ CRASH in Value.PART IB: Here is the INDISPUTABLE Case for an Economic “Hard Landing” and a REAL 2023 US Recession . . . and How You Profit From It!
Part II: Here's How to SAFELY Double Your Wealth in 2002-2025 & NOT Lose Stock Market Wealth --Riding the NEW Commodity Super Cycle Wealth Wave 2022-2025 (feel free to join our subscribers and wealth management clients who are are already up 85%+ in 2022 riding the Commodity Super Cycle 2022-2025)
PART III: TR’s 2022-2023 Most INvestable and Most UNivestable Sectors/Stocks Buy/Sell list (for paid subscribers only).
Welcome!
Note: This series of special reports on the "State of the State" of the 2022-2023 US stock and bond market were created especially for self-directed investor audiences.
#1 Our Paid Transformity Investing Subscribers
It’s been a helluva wealth-building ride these last two years hasn’t it?
Key Point: I want to make sure that both long-time and new subscribers are ALL on the same page—that the death of the “Fed’s Everything Bubble” is a VERY REAL & PRESENT DANGER to your wealth if you are still sticking with growth-at-any-price tech stocks.
There WILL SOON be a time to “bottom fish” high-quality secular growth technology stocks that are getting crushed in the stampede out of tech. It’s just not quite time yet (with a few exceptions).
Note to long term Subscribers: I gotta say this: IF you are not happy with your Ultra Income + Growth portfolio being up 83.2 % up in 2022 versus -15.2 % SP 500 this year, or up 176% from the April 2020 lows vs. just 26.5% for the SP 500, I really don't know what to say except read these special reports and start following our buy/sell/hold advice BETTER!
Here is the latest Transformity Research Ultra Income + Growth Portfolio 2022 Results (for May 16, 2022:
2022 TRP is UP 84.7% — SP 500 DOWN -16.8%—TR vs. SPY Outperformance is 101%
2020-2022 TRP UP 175% — SP 500 UP 24.1%—TR vs. SPY Outperformance 727% or 7.2X
Not surprisingly, the number one question we get from our subscribers is "Toby—is this as far as we go? Should we take our HUGE profits now, hunker down and wait for your bear market "all clear signal?"
The short answer is NO as long as you own a good mix of our 2022-2025 Commodity Super Cycle Beneficiary stocks!
But I still need you to:
1) First read these special reports and make sure you understand WHY optimal Ultra Income + Growth and Ultra Growth portfolio allocation tactics are working so well and why the bursting of the Fed’s EVERYTHING Bubble and the 2023 hard-landing recession we forecast are so dangerous to your hard-earned wealth if you play this path to recession wrong—especially if you are 60+ and ready to start living on your portfolio income!
2) PROTECT your 175%+ Ultra Income + Growth profits in this down -16% SP 500 (and going lower) with sell stops 10% under their 100-day moving averages. The reason for this caution is that ALL stock sectors making those kinds of outrageous relative profits while the overall market is TANKING will have some profit-taking downdrafts to 100-day support levels during a recession-based secular bear market.
EVERY bear market in the last 60 years that preceded a strong recession brought the SP 500 Index down to the 200-week support area—that support area is around 3400.
Gary —200 Week Chart Here and 200 Week QQQ too)
3) Make sure you raise enough cash by cleaning out old dead stocks or ETFs you have left from your pre-Transformity Research days and (if taxable account) trimming some of our 300%-500%-700% up winners from April 2020. That way you have a 10-20% volatility cushion, don't worry at night and have the cash to take advantage of once-a-generation buying opportunities just like April 2020 (when we swooped into the market chaos buying insanely valued energy and tech stocks with 400%-500% and 700% profits!).
#3 Free Wave Wire Subscribers
The next audience we need to address is our complimentary "WaveWire" newsletter subscribers. Their comments are like "OK--I know I shoulda subscribed in 2020 when you went to cash in February and now have made a 175% killing right into 2022.
But their questions are basically "Is it TOO LATE to make some serious money for my portfolio in 2022-2023--how do I get some of that nearly 100% 2022 outperformance?"
The short answer to that question is "No it is not too late--SO CLICK HERE and get a six-month subscription for just $49 with a money-back guarantee if not satisfied.
BUT PERSONALLY, I WOULD RECOMMEND at least a one-year subscription at just $97—you need at least a year to get all the benefits.
Managed Account Clients
The third audience is our Transformity Wealth Management LLC managed account clients and prospects. Since we have been closed to new clients for most of 2021 & 2022 (with the good fortune of TOO MANY clients and not enough staff), we have added more capacity and will be running our Ultra Income + Growth and Ultra Income portfolios for additional clients.
We do have a waiting list (and if you asked to be on that list, you are on the waiting list). If YOU want to be on our Transformity Wealth management waiting list ($500,000 minimum) simply email Marjorie Smith at Marjorie6116@gmail.com and ask to be on the new account waiting list.
And finally, with the new "Buy Hold Sell" investing TV program of which I am a founding contributor and now streaming on Roku, Direct TV, YouTube, and soon other streaming video platforms including Amazon Prime and NewsMax, their question is "Who the heck is Tobin Smith and how can he claim such outperformance?"
Check the show out—Here is a link to some recent episodes.
OK Let’s Go--I firmly believe our research and data will prove there is a LOT of stock market wealth and prosperity ahead IF you learn why our 2022 Transformity Investing Bear Market Playbook is working so well now and in the foreseeable future (2022 to 2023).
Playbook Rule 1.1 When the 11 Year Primary Investing Paradigm and Fed’s Historically Loose Monetary Regime Changes, You HAVE To Change Your Investing Playbook Too (unless you enjoy losing lots of money. See 2000-2003, 2007-2009 and now 2021-2022)
To really understand what is going on in the stock market TODAY, you REALLY need to understand
1) Why and how the Fed’s Everything Bubble was created in the first place in 2010 and more importantly
2) Why in 2022 the Fed has no choice but to POP the Everything Bubble that it ITSELF CREATED in order to save the US economy from the dreaded 1970s stagflation demon (where stubborn embedded price and wage and energy inflation remains higher than GDP growth) by
3) Throwing EVERY GDP growth and monetary trick they have conjured since 2010 INTO COMPLETE REVERSE in order to crash stocks (reverse wealth effect), smack home values (lower fixed rents and mortgages), and kill job creation in order to smother our runaway 7-8% price inflation (and with 11 million US job openings for only 5 million job seekers, good luck with that!).
Understanding Financial Gravity 101
Here is the quick version of how from 2010-to 2021, stocks (17% annual gains) AND bonds (24% gains) and home prices more than doubled their average returns for 11 years in a row—and then suddenly did not (this will be harmless ok?).
For the 40+ million YOLO FOMO “Diamond Hands” novice investors who opened up stock brokerage account apps and via cell phone piled into growth-at-any-price stocks as advised by the hottest Tik Tok or YouTube “stock bro” starting with their $3500 “stimmie check” in Q2 2020, it should go without saying that few have muscle memory to the Dot Com crash 2000-2003 nor the 2008-2010 Great Recession and its 54% stock market crash.
Yet we must look back in recent history to appreciate that the D.N.A. of the market meltdown today can be directly traced back to the 2008 financial crisis. That financial shit show was caused by the popping of the highly leveraged sub-prime mortgage bubble where banks all over the modern world leveraged at 20-50-and even 90X (talking you French banks) loaded with low-cost deposits and bonds created, sold and retained the riskiest “rumps” of $trillions in mortgage-backed securities and then sold them to OTHER highly leveraged financial institutions and hedge funds.
Since anyone in America with a driver’s license could obtain a mortgage that allowed them to borrow up to 100% of the price of their new home (the infamous “NINJA” mortgage no income, no job, and no assets) or buy a rental home or make a quick flip, eventually the United States ran out of people to participate in this multi-$trillion FDIC endorsed Ponzi scheme.
Famously the sub-prime mortgage meltdown wiped out venerable Wall Street investment banks like Bear Stearns and Lehman Brothers and would have without question cratered many others had the federal government not intervened with massive $trillions in a forced bailout. I will never forget interviewing Senate Majority Leader Trent Lott outside the doors of a meeting that told top Congressmen and women that IF they did not pass an emergency funding for the top US commercial banks and investment banks, “there would be no cash in ATMs on Monday morning.”
In that financial doom scrolling event, the Dow Jones Industrial Average peaked at around 14,000 before falling to around 6,500, in March 2009.
Key point: When the stock market loses 54 percent of its value and 20+ million-plus homes plus mortgages default, you get one helluva mighty recession and big recessions + historic wealth destruction create a very negative vicious circle/negative knock-on economic feedback loops. Remember that last sentence.
Fast forward to the new dashing Federal Reserve Chairman Ben Bernanke.
The Bernanke Doctrine
Regarding the Great Depression, … we did it. We’re very sorry. … We won’t do it again.”
—Ben Bernanke, November 8, 2002, in a speech given at “A Conference to Honor Milton Friedman … On the Occasion of His 90th Birthday.”
In 2002, Ben Bernanke, then a member of the Federal Reserve Board of Governors, acknowledged publicly what economists have long believed. The Federal Reserve’s mistakes contributed to the “worst economic disaster in American history.”
But it was not until March 2009 when the Federal Reserve, then led by Fed chairman Ben Bernanke, vowed to do whatever it took to pull the economy out of its funk. Bernanke, with a Ph.D. in economics from M.I.T., was a student of the Great Depression and was determined that HIS Fed would not repeat its tight-money mistakes during the 1930s, which he believed prolonged the financial agony. He decided to flood the zone with cheap money and brought along most of his fellow Fed governors to make that happen.
Ever since 2009, from a monetary policy perspective, we have essentially been living under the Bernanke monetary doctrine aka “The Fed’s Everything Bubble”, continued by his two successors, Janet Yellen, and newly reappointed Jerome Powell. The concept is pretty simple: to escape the downward vicious negative feedback loop of the Great Recession, Bernanke et al. designed a simple plan to A) drive down short-term interest rates, which the Fed controls directly, to near zero, and to B) drive down long-term interest rates, which Bernanke et al. figured out how to control indirectly, to their lowest levels in recorded human history.
Thus the so-called Zero Interest Rate Policy, or ZIRP, was born and the Fed’s plan was marvelously simple: reduce short-term interest rates to zero in the years after the financial crisis and then leave them there. That made short-term borrowings very inexpensive. And this was a boon for Wall Street banks, which obviously use a lot of short-term financing to run their businesses on a day-to-day basis.
But most people, of course, want a long-term mortgage to buy a house or a long-term loan to buy a car. Also, corporations like to borrow money for long periods of time too, five years, seven years, ten years. People who make money from money—including the entire private equity and hedge fund industries—also like to borrow money for long stretches of time, too.
Bernanke’s genius, as it were, was behavioral science 101: There is a huge constituency of people who would love to borrow for a period of years, especially when the money is close to free.
From this brilliant insight also came the so-called Quantitative Easing policy that has been in place since 2009. In its simplest terms, Q.E. was a way for the Fed to go into the open market and buy all sorts of bonds—from Treasuries to mortgage-backed securities, and maybe even a junk-bond fund or two—to drive up the price of these bonds which in turn lowers their effective yields, which of course lowered the cost of long-term money for everyone.
There alas was no Noble Prize for Economics for Mr. Bernanke. But he did prove beyond a shadow of a doubt that free money, especially if sustained over a long period of time, has a wonderfully stimulating economic effect in a capitalist society—it as Keynes would say fires up the animal spirits and gets all sorts of people to borrow money or invest money in new or existing capitalist enterprises and buy homes (and second and third homes).
Key Point: I think it’s safe to say Bernanke’s plan worked better than he, or his fellow Fed governors, could have possibly imagined. Via ZIRP and QE, the bond securities on the Fed’s balance sheet exploded 10X from $900 billion, in 2008, to nearly $9 trillion these days.
And thus the Fed’s Everything Bubble was inflated and (to change metaphors) financial ZERO gravity was born. Zero risk 10-year bonds have always been the “financial gravity” that prices risk assets higher or lower. But when the Fed suppressed 10-year bond rates and rates plunged, zero financial gravity meant risk assets rose in value—and rose and rose and the animal spirited feelings of FOMO and YOLO exploded.
Then when the pandemic hit American shores, in March 2020, the Fed merely doubled down both its zero financial gravity weapons ZIRP and Q.E., and financial assets and home values exploded to new heights.
Riddle me this: how do stocks and bonds go UP in value in a global pandemic?
Answer—the world’s most powerful financial zero gravity machine aka the money printing keyboard at the NY Fed.
It is hard to believe but it’s been 12 YEARS since I wrote our now "sorta famous" report entitled "Welcome To The Fed's NEW Stock Market Party Paradigm: The Age of Free Money & Guaranteed Positive Stock Market Returns Is Here" for the Fox Business Channel website in early 2011 (where I was a paid contributor and part-time anchor for 14 years).
I'll say this: as I reread the opening paragraphs--I think we pretty much nailed the last 12 years!
"Welcome to the Fed's Quantitative Easing Party--The Growth Stock Party Has Just Begun!
Quantitative Easing is Fed Speak jargon usually shortened to QE. QE is a type of non-traditional monetary policy that is implemented by the central bank of a nation when they want to ensure financial assets will rise in value in order to trigger the "Wealth Effect" where households who own financial assets and homes spend more because they feel wealthier (which keeps their economy expanding especially in a low inflation/low GDP growth environment economy running consistently below target growth rates).
The Japan Central Bank originated this concept after the crash of the Japanese stock market in the late 90s (when Japanese stock values reached 50% of ALL the world stock markets BTW). This type of policy includes large-scale purchases of financial assets by the Central Bank in order to stimulate or stabilize the economy. QE is typically implemented ONLY after other traditional monetary policy tools (interest rate cuts) have been used and failed.
Note: QE is NOT the "Fed Put"--that term refers to the belief that the US Federal Reserve Bank will step in to "rescue" any sudden 30%+ sell-off in US stocks or bonds like it did in 1994 (with the Long Term Capital hedge fund implosion) and the implosion of the financial stocks that lead to the Great Recession starting in 2008.
Here's how QE works. In order to buy assets on the market, the Fed simply creates new dollar-denominated funds with the literal push of a key in a cubicle on the second floor of the NYC Federal Reserve office. This process is commonly referred to by "monetarists" aka Perma bears on the US dollar as "printing money" although it is obviously accomplished digitally. With the newly created funds, the Fed then pushed another few buttons and trades its new $cash for debt securities owned by major Federal Reserve member financial institutions.
These purchases effectively swap the bank’s investment holdings for cash while greatly increasing the overall US money supply (which drives the Ron Paul "Gold Bug" cult members and Austrian School of Monetarist Economics cult members crazy.)
The theory is that, with more cash, banks are more inclined to make more loans for longer and thus spread that money around. What we do know is that when quantitative easing is implemented, interest rates do decline lower for longer. When the Fed enters the market as a major supplier of free money with an endless bid to buy US bonds, supply and demand principles push interest rates lower (and also crowd out normal market-based price discovery, too).
Key Point: Yet for stock investors with all this new "cash" in the monetary system aka liquidity, this jolt of cash liquidity encourages investors and businesses to turn on "The Animal Spirits" and turn to riskier investments, like growth equities vs. risk-free bonds, to bolster their returns.
Hence the term “There is No Alternative” aka “TINA. Bear in mind that the advent of a new low <2% inflation rate world of e-commerce, offshore manufacturing lower birth rates/population growth suppressed the only reason to end the Fed’s Every Asset Bubble policy as the only inflation was in investors’ portfolios and home values.
Why? Because of the additional capital entering equity markets and the incentives for businesses to borrow low -cost funds for expansion, quantitative easing can lead to larger stock market gains as in more money chasing a relatively limited supply of stocks with easy returns that make bond yield look too tame aka TINA.
Finally, there is a strong psychological effect of quantitative easing. When the Fed is engaged in buying securities, the perception is that the Fed is throwing a stock market party and taking an active role in bolstering the economy. This perception can lead to more confidence in the stability of the underlying securities, keep the Animal Spirits alive and stimulate real economy economic performance.
Oh, and the 20 year bond bull market (bond rates down, bond prices higher) keeps going (which makes public and private pension funds VERY happy, too).
BUT, while quantitative easing has many benefits as the tidal wave of new cash/money supply rolls in, there are also a few very negative downsides for stocks and bonds when the tidal wave of monetary system liquidity aka the Fed balance sheet eventually shifts gears into reverse to fight rising inflation (aka systemic monetary tightening).
1) Because quantitative easing increases the money supply, it can lead to or exacerbate inflation.
2) There is also significant research showing that large scale asset purchasing can lead to asset bubbles and income inequality, though these findings are somewhat contentious."
In the article, I called this new stock market/bond investing paradigm the "Heads I Win, Tails I Win Stock Market" i.e., a new paradigm of thanks to the FED, risk was reduced and that juiced up stock market valuations.
And we ended the report with this advice "Look--as long as the Fed makes equities win and bonds win too, we are 100% long investors UNTIL THE GREAT QT RECKONING starts (i.e., Quantitative Tightening where the Fed starts to DRAIN the QE OUT of monetary system and raise short term Fed Funds rates enough to reduce aggregate consumer/business demand and REDUCE out-of-control price inflation").
1.2 The Great QE Reckoning Is Here: The $6 Trillion Non-Immaculate QE-to-QT Monetary Tightening Stock Market Wrecking Ball Has Begun
Well obviously the reckoning for the Fed's $6 trillion "Heads I Win, Tails I Win & Every Growth Stock Gets a Trophy" Party 2010-2022 has indeed arrived with a vengeance . . . and its about time. The bad news is IF your stock and bond portfolio is NOT prepared for the extraction of $6 trillion in capital market liquidity and 12x higher interest rates, your average Mega Cap heavy portfolio has about 30% or more downside to go based on our simple math.
Key Point: If you don't have another 12 years to replace a big chunk of your wealth...read the next paragraph carefully because here is the clear and present danger ahead for investors getting near or at retirement.
The big problem I continue to find is that many investors are simply not aware of the THREE data points that tells us HOW FAR out of whack US equities and bond valuations grew via 12 years and $6 trillion of QE support and 8+ years of negative Fed funds rates (0% to .25% annual interest rates minus 2% ish inflation--until 2021):
Key Data Point #1: On January 2, 2022, the value of the US stock market was 62% of the ALL the global stock market cap COMBINED while the US economy is just 26% of the global economy. The Fed had indeed blown a stock market bubble so large in growth stocks that it made the Dot Com bubble look like a tiny water balloon. Remember the 50% of global market cap for Japan in 1990?
Key Data Point #2: By beginning to drain $6 trillion out of the US monetary system and raise interest rates to "inflation-fighting/demand crushing" levels, the Fed's reverse balance sheet pivot has already created a growth stock bear market (QQQ down 25%+ from highs), a bond market bear market, and NEXT comes a bear market in the extreme valued residential housing market bubble. (Note--IF with 20% down and an 80% LTV mortgage you cannot RENT your home for the cost of your monthly mortgage and property taxes, THAT IS the textbook definition of a housing bubble.)
But most important for growth stock investors is . . .
Key Data Point #3: Between 2020 and 2021, more retail investor money (read "stimmie checks" mostly) came into the US stock market than in the last 17 YEARS combined . . .
. . . and now a majority of that new YOLO money has gone to “Money Heaven” aka mostly blown up or coming OUT of the stock market in record amounts of inactive accounts and ETF redemptions.
Note: When you inflate stock market bubble with stimmie checks, it goes up . . . until the money blows up or what's left goes back under the couch . . .then the stock market bubble deflates and market value goes down . . . a lot!
Summary: You and I have to consider THIS Fed-induced tech stock meltdown bear market is really an analog to the Dot Com Meltdown 1.0-- which started May, 2000 and lasted to 2003. PS: it took the newly minted 1999 QQQ Nasdaq 100 13 years to recover its lost valuation from the Dot Com crash.
What happens next? Like any bear market, the valuations of tech stocks with positive cash flow, quality earnings per share and defensible market positions will come down to a reasonable multiple of cash flows valuations in this cycle.
But the no earnings negative cash flow growth-at-any-price tech stocks just like 2000-2003 go down 70-80-90% i.e., like all financial asset balloons they deflate as financial zero gravity growth-at-any-value weighs them until they crash (which has of course happened to hundreds of no earnings secular growth stocks already--see Coinbase, Robinhood, SoFi, Upstart, and just about every SPAC and many no revenue IPOs circa 2020-2022).
Key Point: The reality today is the hypnotized new e-trading retail investor mania of Dot Com 1.0 simply repeated itself with a new hypnotized YOLO FOMO mobile phone stimmie check app trading mania version 2.0 in 2020.
For those of you who were NOT trading Dotcom stocks in1996-2000 it was the ETrade baby ads generation and the theme was "how many eyeballs does you stock have" instead of "what are your earnings-per-share?" Tens of millions of new online trading accounts were opened. It was the first time people could trade stocks on a PC at low discounted commissions. New investors became hypnotized by the riches they were told about on stock bulletin boards on Yahoo + AOL and other platforms. Barbara Streisand was given out dot com stock tips on The Today Show.
CNBC ratings skyrocketed--and one mention of a small cap stock on TV could double the price of the stock DURING the segment.
We all rushed home from the office or closed our office door everyday in 1999 after the market close to see how much money we had made on our Dell, AOL, Blackberry, Cisco, JDSU Uniphase, Yahoo, MicroStrategy, QUALCOMM stocks. Some days our "portfolio" was up 15-20% in a DAY!
Fast forward to 2020. The one constant in the stock market is human behavior and emotions never change. But this time around, 50 million+ newly hypnotized YOLO FOMO GenZ and Millennials' flooded the market with brand new online brokerage accounts and start trading stocks and options on gameified mobile phone trading apps with more new cash brought into the stock market than, as mentioned, the last 17 years combined.
This time these new traders are hypnotized by young stock trading "influencers" on social media apps Twitter/Tiktok/YouTube/Instagram. They posted screen shots on Reddit chat boards of making tens and hundreds of $thousands in a DAY trading SPACS and options. You could smell the YOLO fearless greed and euphoria. As Warren Buffet said recently "Robinhood turned the stock market into a gambling casino--shame on them.!"
But what was SO different in the 2010-2021 Growth Stock Super Cycle is, of course, ZIRP and ultimately $9 trillion of QE! In the 1995-2000 Dot Com day, Chair Alan Greenspan was talking about "irrational exuberance" in stock values and was injecting ZERO new dollars into the US monetary system.
Thus the 2010-2022 Secular Growth Stock Super Cycle turned out to be Dot Com 1.0 on $9 trillion of financial steroids ( metaphor change!).
Let's Fast Forward to Today
The YOLO/FOMO $ARKK and SPAC and IPO bubbles burst because they simply ran out of hypnotized traders/greater fools paying astronomically prices for no-revenue or no-cash flow stocks starting March 2021. Secular tech stocks with actual earnings continued on to peak in November 2021 at 30-60% higher than normal valuations based on earnings multiples.
What different of course with this Super Cycle stock bubble is with the Fed coming clean in November/December 2021 that inflation was NOT "transitory" and tacitly admitting they had made the biggest policy error since Fed Chair Arthur Burns in the late 1970s/early 80s investors, the Fed based Secular Growth Stock Super Cycle peaked and in early 2022 the secular growth tech stock bubble burst.
I believe in today's YOLO jargon the "Fed pulled a Rug Pull" on secular growth stocks.
But here is what most investors--young and older--are still not getting that could cost them massive additional stock market losses.
I find most investors I talk with day-to-day are NOT aware of the unspoken agenda of the Federal Reserve which is: WITH the highest and stickiest CPI inflation in the United States in 40 years mostly caused by a set of historically BRUTAL macroeconomic events in 2020 and 2022 not in the Fed's control on top of the $9 trillion on Fed monetary stimulus the Fed did control, the combined negative macroeconomic gut punch of
1) Supply Chain Price Inflation: With the Global Pandemic Shock still raging in Asia
2) Major Food Price Inflation: War in Europe's Most Important Commodity Producer with Europe's Largest Energy Provider
3) A 50% Energy Price Shock: The World Has Not Seen since the 70's Oil Boycotts
4) A 10-15% Self-Fulfilling Wage Inflation Spiral in Hourly and Salaried Labor Costs
5) The Great American Resignation that Leaves 11.2 Million Job Openings with only 5.2 million job seekers
6) The Great American Boomer Retirement Exodus with 10,000 Baby Boomers turning 65 and 70 every DAY till 2030
all together means that Fed is very well aware (and most investors are not) that the only "tool" the Fed has fight this historically high multi-cause runaway inflation is to smother runaway demand with a historic recession in demand for goods, services and jobs with a 1980's like interest rate "shock and awe" rate hikes and monetary tightening.
Nibbling around the edges won't work because NO Central Bank outside of war time has tamed 7 different drivers of runaway price inflation with 7 different root causes. Today's runaway inflation is like a 7-head Hydra which Chairman Jay Powell has only two weapons to slay: create punitive interest rate hikes and drain $trillions out of the US monetary system.
Today in real time, the Fed's $6 trillion "reverse pivot" with 12x higher interest rates is getting priced into stocks. In stock market terms, that means high p/e growth stocks continue to get "rerated" to lower valuation multiples (because if investors can get zero risk 3%-4%-5% ANNUAL returns from risk free Treasury bonds, high risk/no dividend stocks become FAR less attractive.)

Key Point: But p/e multiple rerating is NOT not the biggest negative issue facing above market P/E growth stocks (i.e., above 18 p/e's) in the Fed's attempt to tamp down 8% inflation rates by draining the tidal wave of cash liquidity and negative interest rates OUT of the monetary system.
Read the following slowly . . . in the 1980's, there WAS NO QQQ or SP 500 market weighted ETFs. There were actively managed mutual funds, but redemptions were ACTIVELY managed (i.e., the porfolio manager sold a little of the portfolio at a time and NOT by market cap).
Fast forward to 2022 where many 401k investors throw money every month into market cap ETF. Now when the major market cap weighted indexes fall in value (SP 500 and QQQ since 1999), the redemptions of these ETFs creates a negative feed back loop and a very NEGATIVE reverse market cap multiplier effect kicks in.
In short, when shares of SP 500 SPY or QQQ ETFs start getting redeemed in BIG numbers ($45 billion net redemptions in April 2022), the HIGHEST market cap stocks (based on market cap weighting) GET SOLD THE MOST--which accelerates the downward index price spiral.
Thus as we warned out subscribers and managed account clients on November 30th when Chairman Powell first admitted the Fed had completely screwed up their "transitory inflation" calls and needed to ramp up the US inflation fight (via $6 trillion of monetary tightening) . . .
. . . we knew that the "The Every Growth Stock Gets A Trophy" valuations where secular growth stocks with 50x-75x-150x or ZERO price/earnings ratios (stocks valued on their gross revenues) were about to get cut by 50%-75%+ in value. We knew this because the social media hypnotized "stimmie check" SPAC IPO mania bubble HAD ALREADY POPPED in March 2021 and then the no earnings social media induced "Disruptor" stock bubble hypnosis within the Queen of QE Cathie Woods world of ARKK funds popped in March 2021.
Next up would be the beat down on the on the rest of the Pandemic Demand Pull Forward cohort of Nasdaq listed stocks to get "schmeissed" --down 50-70% aka undergone serious value demolitions (the OG Wall Street term "schmeissed" comes from the name of a very powerful machine gun called the "schmeisser" created by an engineer Louis Schmeisser").
So the $50 TRILLION question for US stock market investors is "Is the pain trade over? Should I be "buying the growth stock dips" that has worked since the QE juiced stock market started 2010?
1.3 NO Tech Stocks DIPS YET!--The New Central Bank Era + The West's "DeRussification" means a NEW Bear and New BULL Market for the "DeRussiafied" Commodity Market 2022-2023
My first answer to the question above "Is this the bottom?" is always the same humble brag (I can't help myself): "What market turmoil? What bear market? Our managed accounts and newsletter portfolios are UP almost 100% this year over the SP 500 in 2022, including dividends, thanks to our switch to 75% overweight in energy complex investing in July 2021--did you miss the email??"
But my real answer now is timply "You tell me;
1) Given the 12 years/ $9 trillion of monetary stimulus/30 months of 0% negative yield interest rates injected into the US monetary system that
2) Created the BIGGEST STOCK MARKET BUBBLE IN HISTORY (ex- the Bitcoin Bubble)
3) Which juiced the U.S. stock market cap value to explode to 62% of the entire global stock market cap valuation with just 26% of Global GDP
4) And much of the 7-8% spiraling annualized housing and wage and food and energy price inflation in the US EMBEDDED (not transitory) within the US economy for many YEARS to come (labor does not work for less wages unless jobs are scarce and the economy is in a deep recession)
5) And of course the Federal Reserve "tools" can't print oil, natural gas, coal, wheat, corn and fertilizer and
6) Despite the Fed happy talk, EVERYONE should understand the ONLY way to break the back of negative spiraling inflation (where rising prices and wages create a negative feed back loop where higher wages make producers raise product and service prices...which in turn makes employees seek higher wages)
7) With a post-pandemic economy with 11 million job openings but just 5.4 million available workers
8) And a new East/West Cold War 2.0 geopolitical order with the West's sworn mission to "DeRussiafy" the worlds energy and commodity resources
8) Which by definition means HIGHER for LONGER energy and food prices which
9) Means the ONLY possible way the Fed can crush America's supply demand imbalance in just about EVERYTHING is to
10) Create a powerful enough recession in 2023 by raising interest rates high enough so that spiraling consumer demand for EVERYTING is crushed
So NO-- high market whiplash volatility and serious growth stock devaluation is JUST GETTING STARTED!
My proof?
1) Every decade the stock market has a 40%+ down draft--and never in any of those decades have all the above negative economic factors been present ex-World Wars.
2) The negative April-May 2022 SP 500 slide is the worst in 52 years (but historically the SP 500 needs to drop 22% more just to reach the "average recession ahead bear market" down -32.5%).
3) The Nasdaq $NDX Index is down nearly as much as its 2008 crash
4) The Major 2010-2022 ETF tidal wave of QQQ SPY BUYING switched in April to tidal wave of ETF Selling in April just like the beginning of 2008 crash too.
The REALITY for stock market investors in 2022-2023 is . . .
A) The 2010-2021 Fed Created "Buy The Growth Stocks Dip TINA Super Cycle" paradigm is DEADER than a Russian General in Ukraine
B) The BEAR MARKET for ALL Major Indexes ex-Energy & Staples is only About 1/3 Done
C) Most investors in the market have NO IDEA how high the Fed has to take rates to smother 8% inflation (hint: 3% "neutral rates" are not nearly enough
D) The GOOD News is the "Back to the Future" 2021-2025 Commodity Super Cycle In HERE & We are Crushing the SP 500 by nearly 100%!
And You Can Too!
However, if you ignore our advice and "bottom fish" the secular growth stocks too early in this growth stock bear market . . .
. . . owning "suspension of disbelief " no earnings secular money losing growth stocks in 2022 will continue to be the second best way to lose money in your 2022 portfolio--but owning or "dollar cost averaging" into Cathie Woods's TOXIC no earnings "disruptor" tech stocks into a historic tightening of the US monetary system is just insane.
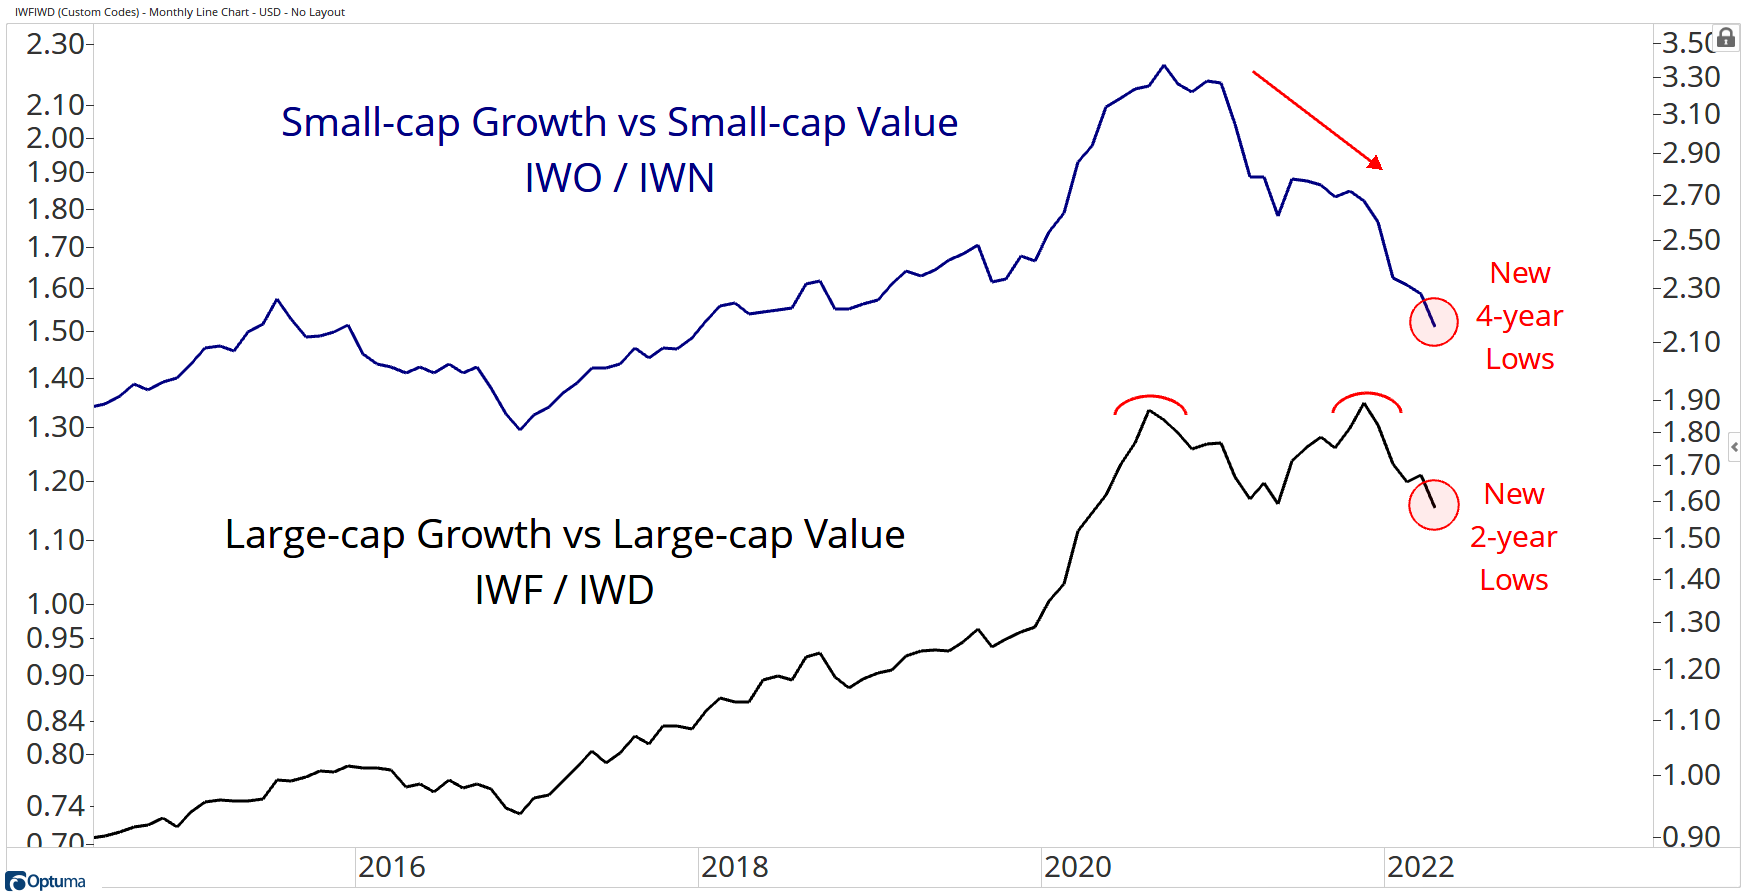
Here is the chart of all Growth vs. Value stocks making new multi-year lows relative to non-Growth:
Note: We are very proud to be able to say that Transformity Research (and our original research service ChangeWave Investing) have always made stupid life changing profits from ALL new economic Super Cycles. . .
. . . and we have the dated buy/sell/hold recommendations to prove it.
For example, we crushed the 5 year Dotcom Super Cycle 1995-2000 (and went to cash in May 2000).
We CRUSHED the China commodity Super Cycle starting in 2002 when China's $trillion industrialization drive began with spurred an endless appetite for all kinds of energy and metals commodities that lasted till 2013-2014.
We also crushed the Fed based $6 trillion "New Normal" SP 500 Super Cycle annual returns 2010-2021 by 525% when the Federal Reserve made cash trash, made risk free bond yields guaranteed to lose money every year and, by pumping $6 TRILLION into the US capital markets, made secular growth stocks the only game in town aka "TINA --their is no alternative! aka the 12 year age of "Every Growth Stocks Gets a Trophy."
For contrast, here are the annual returns for US Hedge funds by style since 2010 (results of which actively managed mutual funds and ETFs mirror EXCEPT you don't have Vanguard 2% and 20% of your profits like the insane world of hedge funds works.)
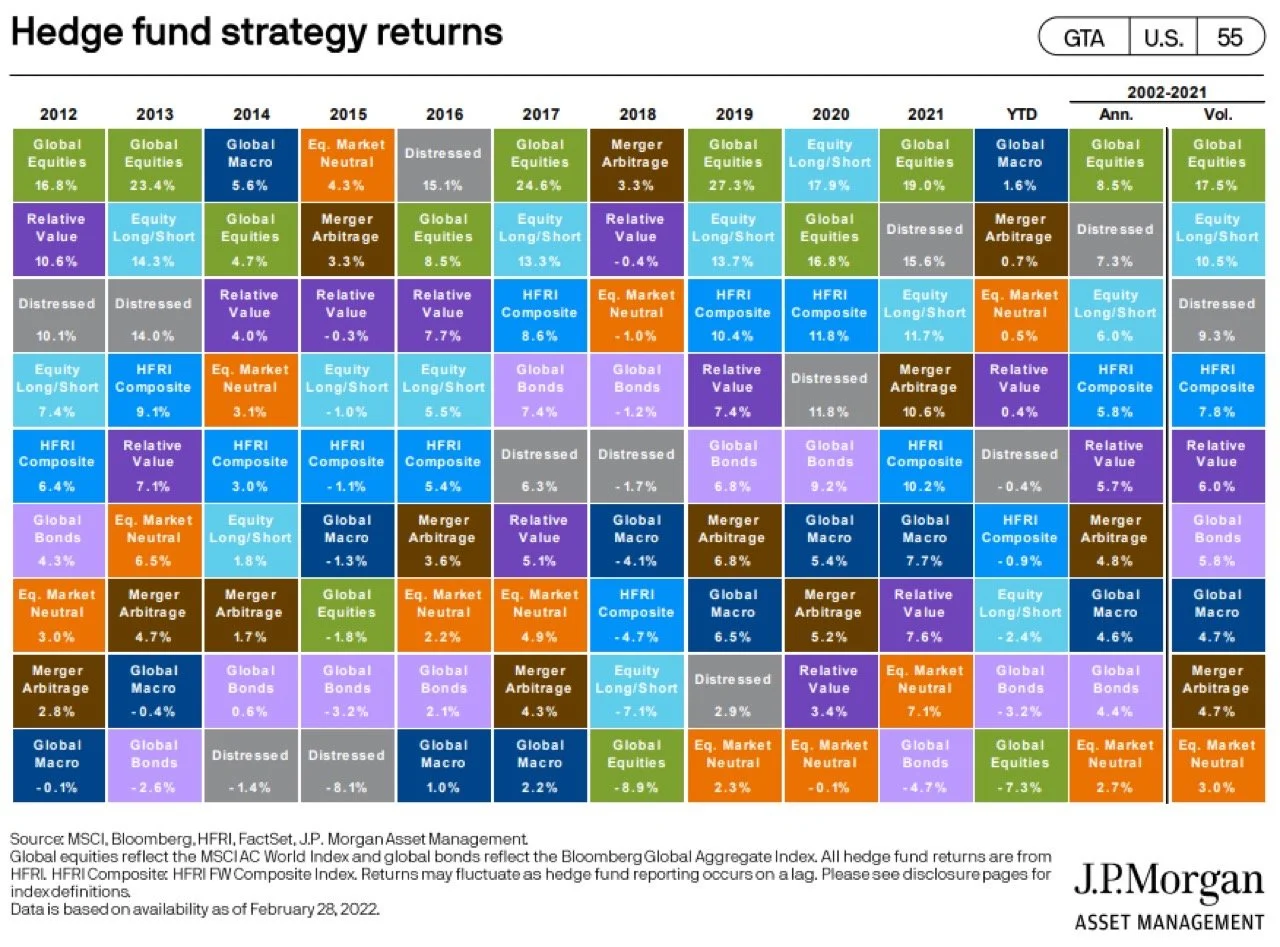
Our Transformity Research Ultra Growth and Ultra Income + Growth portfolios have CRUSHED the heinously expensive hedge fund world LITERALLY by
10-20X to- 1 in the last ten years.
Our Ultra Growth portfolio earned more for our clients and subscribers in two years (2020-2022) than ANY hedge fund has for their investors in the last 10 years.
| Total Portfolio Cash Invested | $180,000. |
|---|---|
| Total Portfolio Gain to Date ($$) | $421,200 |
| Total Percentage Gain to Date | 238.56% |
| S&P 500 Return, 2020 to Date | 26.62% |
| Outperformance of SP 500 2020 to Date 5.8.22 | 9.2X |
ow The Transformity Research Approach to Money Management Is Different
How did we outperform hedge funds in by 9X in the the last 24 months (and 6X from 2012?)
Because we "pray" if you will to the investment God of macro and microeconomic Super Cycles--and because we saw the US inflation genie coming out of the proverbial bottle in July 2021 based on the massive inflation Super Cycle that was building in the US economy.
In that month we actually moved our portfolio weighting 75% to the "Commodity Complex Super and Ultra Growth 25%.
How did it go? REread our outperformance results above.
NOTE: IF you are a trader, the Nasdaq 100 bear market 2022-2023 (like all bear markets) will have many "rip your face off" 2000 point bear market short covering rallies--we have already had at least 3 so far including the "75 Basis Point Fed Rate Hike is OFF the Table" bear market rally on May 4th.
IF you are an investor not a trader, your strategy is now to SELL your No Earnings/Over 35+ P/E legacy tech stocks INTO sharp bear market short covering rips, ok?
PS: Multiple rip your face oof short covering rallies ONLY COME in bear markets!
And With the exception of Apple and Microsoft, ""Disruptor Tech" still has a LONG way to go down still.
How far?
The AVERAGE S&P 500 bull market drawdown ahead of a US GDP recession down -32.5%.
At down just 14.5% in 2022, the SP 500 bear market downdraft ahead of recession has only been 13% priced into the market
(and odds of recession in 2023 is now about a 95% LOCK as I will explain in detail a bit later).
Do a little math and we have, on average, another 20% ish down to go in the SP 500.
Key point: While the Fed orchestrated 2010-2021 bull market party for stocks ran farther and most of all LONGER than any bull market in the last 40 years--the law of financial gravity says " the farther and faster stock valuations climb, the faster and farther they have to fall back to earth."
Financial gravity is a fancy way to describe the power and amplitude of positive and negative investor sentiment--and now especially for the social media hypnotized YOLO FOMO "investors" whose "diamond hands" growth stock portfolio values have been chain sawed to down 40-60% or more (according to our sources inside Robinhood trading app they have lost 46% of their 37 MILLION YOLO FOMO trading accounts opened in 2020-2021)...
. . . this growth stock bear market is NOT going to be "normal."
Look at the damage so far on all the FOMO "can't lose" former stock market leaders.
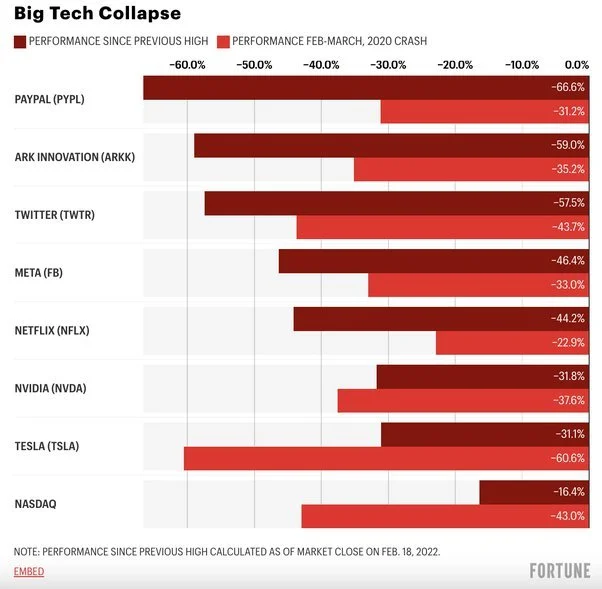
As of 5/9/22
74% of the stocks in the Nasdaq Composite Index were down 30%+
50% of stocks were down 50%+
38% of stocks were down 60%+
Now compare Nasdaq stocks to some of our Ultra Income + Growth stocks are up 300%-400%-500% from the 2020 April bottom
| DCP Midstream | DCP | 4/16/2020$10K | Shares1754 | Yield 5.78% | $1.56 | Price 35.42 | Total Gain 44,865. | Total Gain 548.77% | Gain 2022 $15,400 | Outperformance of SP 500 2020 to Date 5.8.22 | 9.2X | DCP Midstream | DCP | 4/16/2020$10K | Shares1754 | Yield 5.78% | $1.56 | Price 35.42 | Total Gain 44,865. | Total Gain 548.77% | Gain 2022 $15,400 | USAC | 4/1/2020 | $4.73 | 2200 | Yield 14.60% | $2.10 | Price $18.05 | Value $33,924.00 | Total Return 326.00% | Gain 2022 $6,952.00 | $33,924.00Total Gain |
AM | 4/16/2020 | $2.85 | $9.89 | 3510 | Yield 8.94% | $0.90 | $10.28 | Total Value $29,238.30 | Total Return 292.28% |
2022 Gain $4,527.90 | Total Gain $19,238.30 |
|||||||||||||||||||||||||||||
|---|---|---|---|---|---|---|---|---|---|---|---|---|---|---|---|---|---|---|---|---|---|---|---|---|---|---|---|---|---|---|---|---|---|---|---|---|---|---|---|---|---|---|---|---|---|---|---|---|---|---|---|---|---|---|---|---|---|---|---|---|---|---|---|---|---|---|---|---|---|---|---|---|---|
| USAC | |
4/1/2020 | $4.73 | |
2200 | Yield 14.60% | $2.10 | |
|
|
Price $18.05 | Value $33,924.00 | |
|
Total Return 326.00% | Gain 2022 $6,952.00 | |||||||||||||||||||||||||||||||||||||||||||||||||||||||||
| $33,924.00Total Gain | 4/16/2020$10K | Shares1754 | Yield 5.78% | $1.56 | Price 35.42 | Total Gain 44,865. | Total Gain 548.77% | Gain 2022 $15,400 | USAC | 4/1/2020 | $4.73 | 2200 | Yield 14.60% | $2.10 | Price $18.05 | Value $33,924.00 | Total Return 326.00% | Gain 2022 $6,952.00 | $33,924.00Total Gain |
AM | 4/16/2020 | $2.85 | $9.89 | 3510 | Yield 8.94% | $0.90 | $10.28 | Total Value $29,238.30 | Total Return 292.28% |
2022 Gain $4,527.90 | Total Gain $19,238.30 |
||||||||||||||||||||||||||||||||||||||||||
| Shares1754 | Yield 5.78% | $1.56 | Price 35.42 | Total Gain 44,865. | Total Gain 548.77% | Gain 2022 $15,400 | USAC | 4/1/2020 | $4.73 | 2200 | Yield 14.60% | $2.10 | Price $18.05 | Value $33,924.00 | Total Return 326.00% | Gain 2022 $6,952.00 | $33,924.00Total Gain |
AM | 4/16/2020 | $2.85 | $9.89 | 3510 | Yield 8.94% | $0.90 | $10.28 | Total Value $29,238.30 | Total Return 292.28% |
2022 Gain $4,527.90 | Total Gain $19,238.30 |
||||||||||||||||||||||||||||||||||||||||||||
| Yield 5.78% | $1.56 | Price 35.42 | Total Gain 44,865. | Total Gain 548.77% | Gain 2022 $15,400 | USAC | 4/1/2020 | $4.73 | 2200 | Yield 14.60% | $2.10 | Price $18.05 | Value $33,924.00 | Total Return 326.00% | Gain 2022 $6,952.00 | $33,924.00Total Gain |
AM | 4/16/2020 | $2.85 | $9.89 | 3510 | Yield 8.94% | $0.90 | $10.28 | Total Value $29,238.30 | Total Return 292.28% |
2022 Gain $4,527.90 | Total Gain $19,238.30 |
|||||||||||||||||||||||||||||||||||||||||||||
| AM | |
4/16/2020 | $2.85 | #### | 3510 | Yield 8.94% | $0.90 | |
|
|
$10.28 | Total Value $29,238.30 | |
|
2022 Gain $4,527.90 | ||||||||||||||||||||||||||||||||||||||||||||||||||||||||||
| Total Return | Total Gain | ||||||||||||||||||||||||||||||||||||||||||||||||||||||||||||||||||||||||
| 292.28% | $19,238.30 | ||||||||||||||||||||||||||||||||||||||||||||||||||||||||||||||||||||||||
| DCP Midstream | DCP | 4/16/2020$10K | Shares1754 | Yield 5.78% | $1.56 | Price 35.42 | Total Gain 44,865. | Total Gain 548.77% | Gain 2022 $15,400 | ||||||||||||||||||||||||||||||||||||||||||||||||||||||||||||||||
| USAC | 4/1/2020 | $4.73 | 2200 | Yield 14.60% | $2.10 | Price $18.05 | Value $33,924.00 | Total Return 326.00% | Gain 2022 $6,952.00 | $33,924.00Total Gain |
|||||||||||||||||||||||||||||||||||||||||||||||||||||||||||||||
| AM | 4/16/2020 | $2.85 | $9.89 | 3510 | Yield 8.94% | $0.90 | $10.28 | Total Value $29,238.30 | Total Return 292.28% |
2022 Gain $4,527.90 | Total Gain $19,238.30 |
Furthermore, in the month of April, a tsunami of redemptions hit the QQQ and SP 500 market cap weighted ETFs. In fact, equity funds suffered outflows for three straight weeks through Wednesday, the longest streak of withdrawals since August 2020, data compiled by EPFR Global.
Over the span, $32 billion was pulled out of just THOSE ETFs. That’s a stark contrast from the first three months of 2022, when all but three separate weeks saw inflows, with funds sucking in almost $200 billion in total.
Key Point: How much farther does the tech stock implosion have to go?
Well riddle me this my new friend: NEVER in the history of the US stock market in the age of the Federal Reserve Bank (founded December 1913) has the Fed EVER had to introduce such a powerfully toxic brew of restrictive monetary policy into the 2022-2023 US capital markets ALL AT the SAME TIME.
The Fed is charged by Congress to
1) To fight runaway and "sticky" energy/wage/housing inflation spiral --we now know about the 50bps May, 50bpsJune and 50 bps in July cha-cha and wait till September to see "how the tools are working"
2) But Fed Futures and 2-year Treasury Bond yields tell us that Fed Fund interest rates will be 12-15X HIGHER from the 12 years of 0%-.25%
3) Quantitative Tightening (QT) means the Fed has to start DRAINING at least $6 TRILLION of liquidity OUT of the monetary sytem (which monetary math says is the equivalent of and additional 2% of monetary tightening) at a rate of $1 trillion per year (after a 3 month warm up of $60 billion a month).
4) While Retail Investors automatically buying SP 500 and Nasdaq 100 indexes with $billions of cash INFlows for the last ten years are now MASSIVELY reversing the previously positive 11-year self-reinforcing stock market ETF index capital inflows effect with negative OUTFLOWS.
5) And most hypnotized "QQQ/ARKK/YOLO growth investors" who got their "investment advice" from GenZ "stock market experts on Tik Tok, YouTube, Twitter or Redditt are flush out of "stimmie" checks are bailing out of the stock market and licking their wounds in record numbers.
Robinhood just reported 43% LESS active accounts in April 2022 than April 2021( are closing their mobile phone app trading accounts in record numbers.) SoFi and Coinbase reports around 40% less active accounts too--and the no earnings secular growth stock hypnosis wipeout has a LONG way to go as April and May brokerage statements get opened!.
Key Point: These YOLO FOMO Diamond Hands rookie "investors" had been the "price/value insensitive" buyers in the market for May 2020 to Dec 2021 (aka the "marginal buyer."). This is important because the price/value insensitive marginal buyer of any auction type market SETS THE PRICE of any given security.
Really Key point: Since the Mega Cap Growth Stocks are 25% weighted in the market cap weighted SP 500 and about 40% of the QQQ indexes, guess which stocks get automatically sold en masse most EVERY day there are capital outflows OUT of QQQ and SP 500 $SPY ETFs??
Really Key Point: NO ONE knows how far down high p/e/ no p/e and no dividend tech stocks or no earnings stocks need to be rerated downward in price-to-earnings ratios or price-to-revenues (relative to no risk Treasury bonds soon yielding 4-5%).
But as mentioned, the average SP 500 bull market turned to a bear market with a future recession on its way (of which we are certain arrives in 2023) is -32.5%.
The real issue to remember is the 15% annual return for Nasdaq QQQ stockholders that lasted for 11 years was more that than double the normal 7% return on stocks since 1989.
And the Law of Financial Gravity--"the faster the out performance rally up, the greater the ride down back." Historically this "reversion to the mean" means that a lot of the outperformance of QQQ stocks for 11 years over the SP 500 performance (66%) will largely come OUT of the QQQ stocks valuations.
As my first hero on Wall Street Bob Farrell from Merrill Lynch instructed me early in the 1980's
1. Markets return to the mean over time
By “return to the mean,” Farrell reminds investors that when stocks go too far in one direction, they tend to come back to their long-term trend. Overly euphoric or pessimistic markets cloud people’s estimation and judgment of what they can reasonably expect (my term is social media induced hypnosis.)
2. Excesses in one direction will lead to an opposite excess in the other direction
Markets in a bubble can seem ready to pop, yet they manage to stretch into unrecognizable shapes — and still find buyers. Think of Internet shares a decade ago or real estate before the housing crash or more recently the crash of hypnotic mania SPACS or Cathie Woods $ARKK cult stocks.
YO dude--when a hypnotic stock mania bubble bursts, watch out.
3. There are no new eras — excesses are never permanent
This relates to rules No. 1 and No. 2. Many investors latch on to the latest hot sector, and soon a fever builds that “this time it’s different.” It never is, of course. When the sector cools, individual shareholders are usually the last to know and and many blow up a small (or large) fortune.
4. Exponential rapidly rising or falling markets usually go further than you think, but they do not correct by going sideways
This is Farrell’s way of saying that a popular sector can stay hot for a long while, but will fall hard when the valuation correction inevitably occurs
.
5. The public buys the most at the top and the least at the bottom
Nobody rings a bell at the top of a hypnotic stock mania. The mania stocks simply keep rising until the theme runs out of enough hypnotized maniacs aka the marginal buyers aka "greater fools."
6. Markets are strongest when they are broad and weakest when they narrow to a handful of blue-chip names
That’s what happened with the “Nifty 50” stocks of the early 1970s, when much of the market’s gains came from the 50 biggest U.S. companies. As their price-to-earnings ratios climbed to unsustainable levels, these “one-decision” stocks eventually capsized. Ditto Dotcom stocks and energy fracking stocks and MLPs into 2014.
7. Fed tightening bear markets especially have three stages — sharp down, reflexive rebound and then the drawn-out fundamental and price/earnings or revenue multiple compression aka a long sickening downtrend
8. And finally, when all the experts and forecasts agree — something else is going to happen
Going against the herd as Farrell repeatedly suggests can be quite profitable, especially for patient buyers who can raise cash in frothy markets and reinvest it when sentiment is darkest.
In contrast, I am confident that by riding the NEW stock market investing paradigm theme--"In the NEW DeRussiafied Commodity Super Cycle We Trust" I can tell you exactly why we will continue to crush the "market" indexes:
1) At Transformity Research, we don't look at stocks the way most investment managers--like I said we are "investing style" agnostic and have continued to grow wealth in bull and bear markets (especially tech stock mania burst bubbles).
2) We are Macro and Micro Super Cycle Shape Shifters--when the investing environment and Super Cycle paradigm changes, we change our investment paradigm and strategy, too--don't you?
3) Most investors have never successfully managed and made money or sold buy+sell+hold investment advice through 3 bear markets 2000/2008/2022 as we have
4) We have boots-on-the ground research advantage over Wall Street analysts who live in NYC--we built a 2500+ global Subject Matter Experts network that informs us about positive and negative transformational events firsthand, not from Wall Street "research" that everyone gets every day.
The most recent example of this edge is when we were alerted our subscribers EARLY that the "China Flu" was spreading quickly in China cities (and China being a country where 5 MILLION people fly in and out of every day especially to Europe--every been to Venice Italy in season?).
Based on this intel, we went to full hedging in late January and CASH on February 20th 2020 and actually MADE huge profits in the Covid Crash March to April 2020.
Big Point: We are NOT perma bears--we don't hate tech stocks. We are not perma tech growth stock bulls either--especially when the Fed has explicity instructed the capital markets that "The Never Ending Stock Party has Ended!"
While the perma bears (see Jon Hussman Peter Schiff et al) got crushed 2010-2022, we LOVED riding the secular growth wave in global tech stocks 2010-2021!.
We owned and made HUGE profits in tech stocks pre-Dot Com Crash. In the post Financial meltdown every tech growth stock gets a trophy 2010 to July 2021 growth stock party--we owned and recommended $AMD $NVDA $MRVL $AMAT $LRCX $APPL $QCOM etc. etc. for subscribers and managed accounts and made killings (like $AMD from $2.75, $NVDA from $22, $TSLA from $85 after the 2009 IPO).
For Pete's sake--I wrote a NY Times best-selling investment strategy and tactics book in 2000 on disruptive technology investing.....before anyone ever heard of Cathie Wood!
ChangeWave Investing 2.0 It's $5 on Amazon Kindle or $14 recorded on a CD.
BUT--what all hypnotic stock mania Super Cycle like the most recent "Don't Fight the Fed/The Fed Has Your Back/TINA/YOLO/FOMO" 2010-2021 stock mania end the same way. Either
1) the mania runs of our YOLO FOMO hypnotized greedy greater fools or
2) When Fed is purposely jacking up financial asset values for 12 years (0% Fed Funds rates and shoveling 6 trillion dollars into the US monetary system from 2010-2022 to maintain the highly stimulative "wealth effect" ) in order to keep the economy out of recession (or save the economy in a pandemic)
3) And then the Fed stops propping up growth stocks and the economy and has to UNWIND aka liquidate $9 trillion of bonds and raise cost of borrowing money 12-X+ . . .
. . . You get the "Great Fed YOLO-to-Oh NO Financial Bear Market UNWIND !"
All of a sudden financial gravity and fear of losing a LOT of money rears its ugly head:
A) Financial Risk vs. Reward and realistic company valuations matter a LOT and dividends matter a lot, too (dividends in non-stock mania eras account for 50%+ of your market returns)
B) A 50%+ retirement capital destruction event will change your life and not in a good way.
C) ALL "TINA sure thing" investing manias depend on the law of the greater fools buying you out of your position at a profit.
D) All investing/financial manias eventually come to an end because you run out of greater fools or the greater fools run out of money
E) You "Don't Fight the Fed When It's Fighting Runaway Inflation"
F) You TAKE most of the and massive growth stock profits you made into the Fed Monetary Super Cycle 2010-2021
I) You BUY low p/e high dividend commodity-based assets and ride out the upcoming Fed-induced recession and likely stagflation and you
J) You STILL make lots of money plus cashing BIG dividend checks riding the NEXT wealth building super cycle!
All of which brings us to this new moment in history, May 2022--
The Back To The Future/DeRussification Investment Paradigm Transformation Goes Ballistic
The US Fed is telling us a grand fairy tale that they are going weave a magical monetary transformation from historically loose to historically tight that will:
1) "Curb excess demand that causes employers to eliminate vacancies in their labor force without laying off their labor force" (with the now historically low 3.6% unemployment rate after the Great Resignation and 10,000 Americans turning 65 or 70 till 2030)
2) While 5 Million US Jobs remain vacant and over 70% of job movements in the last 12 months has gone to labor with an average of 35%-55% HIGHER salaries, hourly wages and perks (depending on the position)
3) Knowing that rising labor costs do NOT revert back to old labor costs except in a major deep recession (when did you ever take a 25% pay cut unless it was that or lose your job?)
4) The Fed says they will take down YOY inflation to "acceptable levels," i.e., 2% ish in the next 12-18 months as the high 2021 "base rates" comparisons reverse (aka the 2021 rent equivalent for an owned dwelling, new and used cars, groceries, utilities and discretionary spending peak and YOY comparisons are much lower.)
5) While at the same time raising interest rates 4-5X on the two most significant components of US GDP (housing and automobiles), which represent nearly 25% of annual US GDP and are the highest consumer products correlated to interest rates?
6) With a higher for longer energy price shock that takes Russian and Ukrainian oil, nat gas, uranium, fertilizer, potash, wheat, corn OUT of the global markets (Russia sends them to China and India who desparately need all the above)
Ironically, with 1.6 million homes under construction in the US--the most since the 1970s and 2X the amount of last year--with mortgage applications down 36% at big banks--we are just as likely to have a new housing bust as a boom in 2023.
Soft landing--really?
Conceptually, the Fed soft landing 1) breaks inflation with economic suppression of 15X higher rates (taking the marginal buyer out of the interest-sensitive housing and auto markets) while the 64% of Americans who live paycheck to paycheck absorb 8% inflation rates/$4+ per gallon gasoline/pay rents that are up 26% and are NOT GOING down without a significant recession.
Key Point: It should be evident to the markets and normal people that the US Federal Reserve bank cannot deliever the following solutions/price stability to the Post-Ukrainian Invasion/DeRussification price inflation world we live in.
In no specific order, the US Fed cannot
1) Print oil or natural gas to lower energy prices
2) Print wheat and corn and fertilizer to lower the prices of commodities to feed the first, second and third world
3) Get large tankers and bulk shippers to take Russian commodities from the Black Sea
4) Reduce the 15-25% wage and salary increases in hundreds of US job categories by decree
5) Keep the US dollar from rising or the Japanese Yen and European Euro currencies from a significant devaluation ( which makes US exports of goods and services MORE expensive and less competitive.
In the short run, the Fed and other central banks can only do ONE thing with their "tools"--with head shakingly high interest rates, they CAN reduce agregate demand that cools down the gummed up post pandemic supply chain of the US (and global) economy all to reduce runaway price inflation.
The problem with their solution --as we have pointed out repeatedly--is that based on the 2022 bear markets already mauling economically sensitive sectors like SP 500 banks, home builders, home furnishing companies, retailers (ex-grocery chains), auto parts, and non-seaborn transports--relative to non-cyclical defensive sectors like consumer staples, utilities, and healthcare ex-hospitals (HCA's report of runaway labor costs are crushing hospital stocks), we have seen this prelude to recession movie before.
In 1998-2001, 2004-2008, and 2018-2020 recessions, the exact patterns of the economically and interest rate sensitive sectors rolling over ahead of 2 quarters of GPD contraction (a recession) reared their ugly heads.
There is no "model" in macroeconomics for where we are right now--especially in a midterm election cycle which is the worst period for stocks.
And why should anyone believe the Fed is smarter than what the bond and stock market combined are telling us?
Final Point:
Our base case for the next 24 months is a new form of "stagflation" where "sticky" higher prices for mortgages/rents/cost of labor remains higher than GDP growth, and at SOME point as jobs disappear in alarming numbers at the low end of the wage scale, the Fed can't take the pain any longer and then pauses the march to 3.5% "neutral" monetary accommodation" rates.
We can forget about a summer 2022 recession--it can't happen when the US economy is at 3.5% unemployment rates AND there are still 5 Million+ unfilled jobs--ain't going to happen.
But if you look at the Atlanta Fed Real-Time GDP data, we are damn close!
But as we get into 2023, it's not just that all this monetary tightening has NEVER EVER been done before in macroeconomic history; it's that most monetary economists I follow conclude that draining $1 trillion of capital out of the US monetary system every year is ALSO roughly ADDING the equivalent of ANOTHER 0.5% of monetary tightening at the same time the Fed is historically raising the cost of Fed Funds 12X.
All of this is supposed to have the US economy in 12-16 months magically arrive at the Fed's "neutral rate" of 2.5-3% Fed funds rate without a fairly potent recession (the neutral rate is what the Fed deems is neither economically stimulative nor restrictive...right)
That math doesn't add up, and as they say in Texas "that dog won't hunt!"
Let's look at the facts and you judge for yourself.
On January 6, 2020, the US Federal Reserve had around $4 trillion of bonds on its balance sheet. On January 4, 2021, after fighting the first global pandemic in 100 years, that number increased to $6.7 trillion.
But on January 4, 2022, the Fed's balance sheet (Treasury Bonds and Mortgage-Backed Bonds) exceeded the $9.5 trillion they had purchased by pushing a little red button at the NY Fed that bought those securities from banks and deposited cash in those same Federal Reserve banks that was created out of thin air.
My point again? There is no HISTORIC MODEL to forecast what happens to the US macro and real economy when you massively tighten the heretofore loosest monetary policy in the world.
But let's just take a swing at this.
First, who will buy all those bonds and mortgage-backed securities at today's WAY below inflation rates? To move $trillions in Fed "paper" the only logical forecast is they are going to HAVE TO put those bonds on "yard sale," i.e., REALLY lower the price (thus REALLY raise risk-free fixed-rate yields).
30-year mortgage rates today are 5.3% (please, Lord, don't tell me any of our subscribers just took out an adjustable-rate mortgage!). The 10-year bond rate (which mortgages are priced off) hit 3.35% today on May 8th.
When 10-year bonds are yielding 5-6% after all this "Quantitative Tightening," aka QT, that makes mortgages (for the best qualified) 7.5%--remember when we thought that was a LOW mortgage rate in the 80's?
QT makes auto loans (now for new cars 4.06% for new cars, and 8.21% for used cars--all with 700+ Fico scores) in 2023 up to 6-7% percent for new vehicles and over 12% for used cars.
Let's assume that global oil prices DO come down by 2023 as some of the sanctions on Iranian and Venezuelan oil come off as part of the DeRussification of the global economy (and Libyan rebels stop blowing up processing plants and start living large on $100 oil).
But my friends--the $trillion question that lies before us is this: In an 8% ish YOY inflation riddled economy, how much will the Fed have to discount $5-$6 trillion of US sovereign debt prices to "move the paper"? And with bond-buying fund flows rapidly diminishing due to the MASSIVE trillions in losses in the US Bond market already ("Risk-Free" US Bonds are down 12% in value so far in 2022), who is going to buy $trillion of this paper that just started to pour into the global money markets?
And let's not forget, the Fed is also on the hook for raising the regular financing of the 2022 Federal deficit (@$475 billion from October 2021 to Feb 2022).
Key Point: How all of the above ripples through the REAL Economy is simply unknown. But the real effects of 50% higher borrowing costs and real 8%+ YOY inflation rates are well known.
PS--what is NOT well known is that the Bureau of Labor Statistics (BLS) has twice changed the way they measure price inflation since 1981--and if you use OG inflation measurement prices in March, US prices inflation rates were16.8%, according to my pal John Williams "Shadow Government Statistics." I know my $45 fill-up 2-door hot rod BMW now costs $95. I know my prime NY strip at $22 a pound is now $32 (heaven forfend good Gin and wine get the same treatment--oh yea there is Costco!).
And can someone smarter than me tell me "WHO takes the losses when the Fed sells its huge MBS portfolio at $trillion of stunning paper losses?" Just curious.
And don't tell me this is the case for bitcoin--it has deflated 55% ish while all this money was printed--wasn't that the "sell" aka use case for bitcoin--that "fiat money printing" was over, and 21 million BTC tokens forever is the real inflation hedge?
And Then There is Post-Pandemic + Energy Shock Inflation + 35% US Housing Price Inflation Thang
Traditionally, when price inflation gets out of hand you raise the cost of borrowing money to knock down marginal buyers out of the demand for big purchases like motor vehicles and housing. That usually works since about $250 billion of US GDP comes from vehicle manufacturing and sales but the big monster is the US housing market which makes up 40% of consumer price inflation and about 20% of GDP.
But riddle me this? What happens when demand for housing slows but prices still rise because of such low inventory in the places the new post-pandemic hybrid workers want to move to?
Our Base Case for 2022-2023: Stagflation Light
"Screw Russia Trade aka SRT" IS the MOST rapidly growing demand S-Curve transformation I have ever witnessed. While the stock market indexes melt, our SRT portfolio (LNG, Oil Tankers, Bulk Shippers, Natural Gas Infrastructure) and soon some other SRT plays (food commodities and other SRT beneficiaries) are up over 80% in 2022.
Key Point: The "SRT" trade is reordering the global business of oil/nat gas/ coal/LNG /wheat /corn/oats/fertilizer
Today, with the rapid, massive global reordering of the Eastern/Western global economies and the new "DeRussification" of commodities sourced from Russia, we have entered another commodity "super cycle" as my friend J.C. Parets (my fave technician of all time) which shows we will make tens of thousands of NEW millionaires in the next few years riding the commodity supercycle wave.
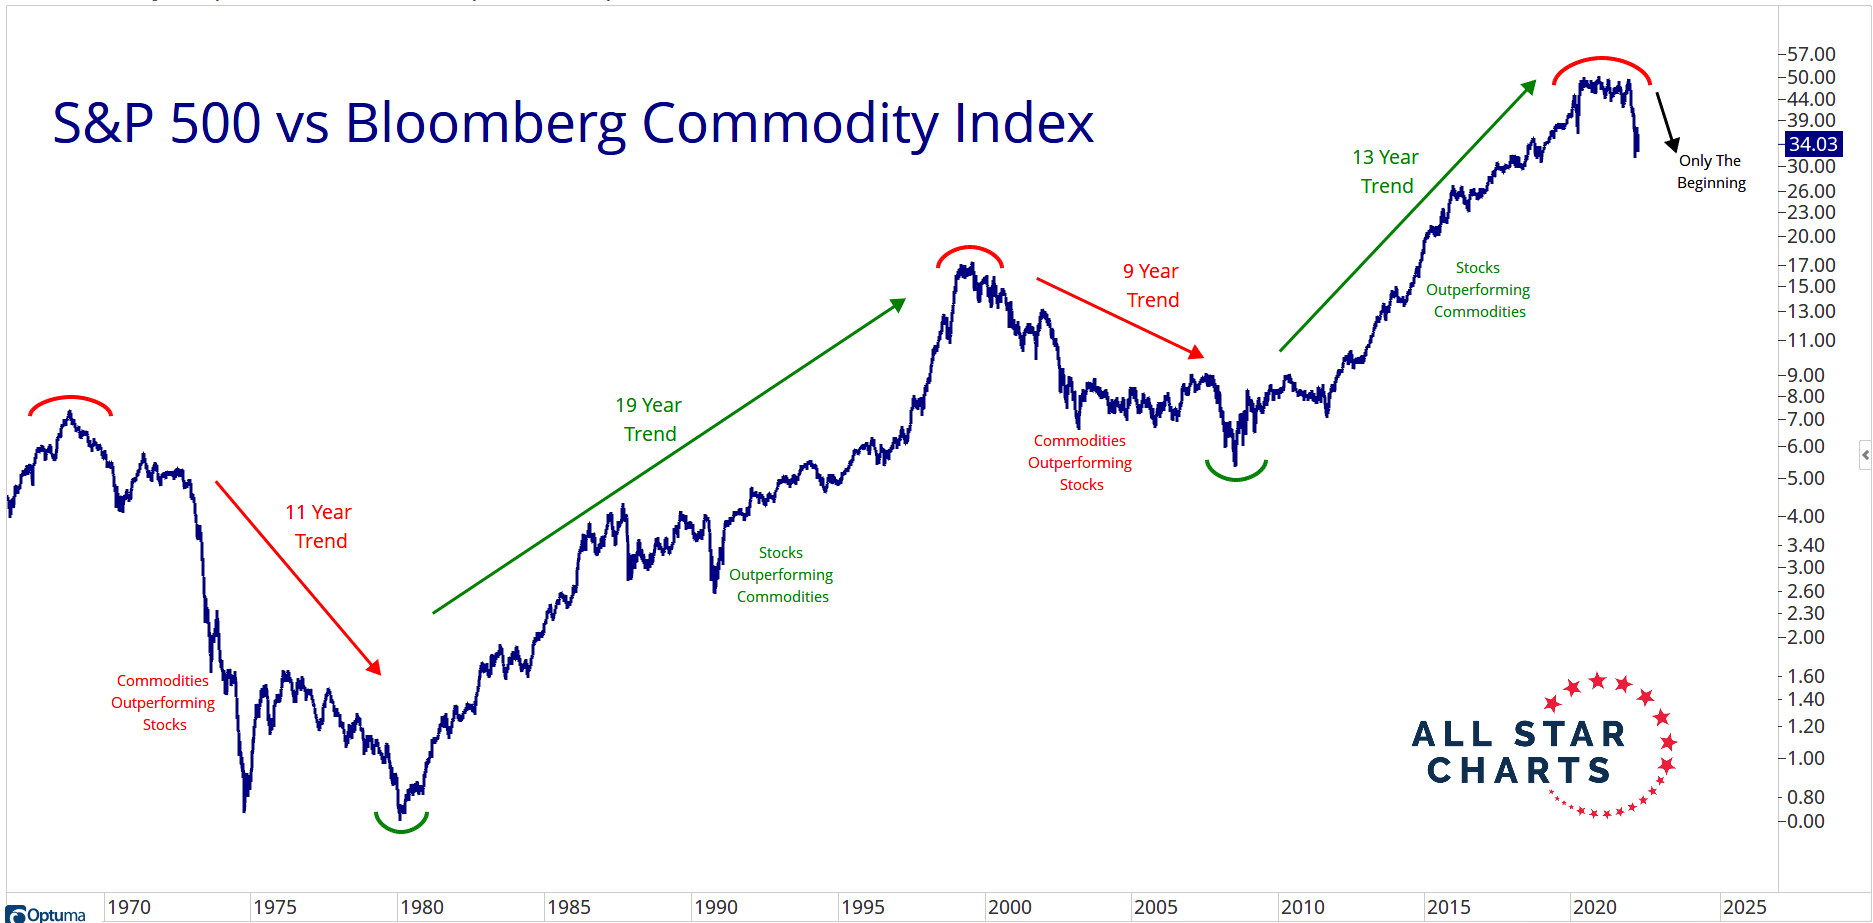
Wanna know how to play this this 2022-2025 DeRussiafied Commodity Super Cycle and double your retirement portfolio over the next 2-3 years (or faster)?
Click here and Subscribe to our investment research newsletter here--6 months is just $49.
IF you are already a paid subscriber, Part III of the DeRussiafied Commodity Super Cycle Playbook comes next and will be posted on our site (and emailed).
We have some quick BUY/SELL/HOLD updates out starting tomorrow--be sure to look for our next 25%+ annual dividend paying winner tomorrow.
NOTE: We are advising taking profits on our $SONO Sonos position tomorrow ahead of their earnings--too much risk of being Netflixed!
Peace Out!
Toby