
It Brings Me No Pleasure To Say "I Told You So"

Please Feel Free to Share This Market Meltdown Update With "Buy and Hold Forever" Friends & Family--Because While the "Growth-at-Any-Price" Fever Dream" Stocks Have ALL Crashed 70%--The Next Tech Stock Crash Is NOW Moving Upstream
Hey Subscriber
1) Gary the new tech guy has updated the Income + Growth Performance spreadsheet and we updated BUY UNDER prices.
PS--the idea of Buy Under prices is to encourage you to be PATIENT and let our best-performing ideas come back to key support levels so your cost basis is as LOW as possible!
Since we are sending out a bunch of renewal notices this week, here is 2022 to date and 2020-2022 performance in our 85% weighted Ultra Income + Growth Portfolio
| Total Portfolio Returns 2022 To Date | |||
|---|---|---|---|
| Total Portfolio Cash Invested | $190,000.00 | ||
| Total Portfolio Gain/Loss to date ($$) | $158,349.77 | ||
| Total Percentage Gain 2022 | 83.34% | ||
| S&P 500 Return, Year to Date | -17.97% | ||
| SP 500 Outperformance 2022 (X) | 4.64X | ||
| Total Portfolio Returns 2020-2022 | $330,319.23 | ||
| Total Percentage Gain 2020-2022 | 173.85% | ||
| S&P 500 Return, 2020 to Date | 21.54% | ||
| SP 500 Outperformance 2020 to Date | 8.1X | ||
PS--We are proud to announce that according to the Hulbert Newsletter Rating service (owned by the WSJ), since 2020 our Transformity Investing newsletter has
A) IS the #1 performing investment newsletter in the United States (actually since 2014 but who is counting)
B) $100,000 in Transformity Research's Buy/Hold/Sell advice from the day AFTER original recommendations has outperformed the average US-published investment newsletters followed by Hulbert by over 850% or 8.5X.
C) And for those Masters of the Universe hedge funds who charge their investors a 2% annual fee and 20% of net profits, TR has beaten the 2022 return of The Goldman Sachs Hedge Industry VIP ETF by 114% and beaten the 5 years 52.5% GVIP returns by 10.2X TIMES in just 2 years!
This reminds me of a lovely email I got from a newsletter and managed account client. He wrote
"Toby you will love this. I printed out my TR Wealth Management account statement for 2022 so up 81% to date including reinvested dividends and sent it to my snot-nosed brother-in-law. He emailed me back "That is not possible--you should pull your money--that looks like a Madoff statement!"
$625,063.27 is his total at the end of the day today in his managed account at Schwab not Madoff (BTW he started with $250,000 in cash in January 2020 which we kept in cash until April 2020)
He was UP $21,02.54 today (+3.48%) with the big run of our bulk, shipping container and energy shippers lead by amazing numbers and dividend raise at $GOGL
Why waste your time with the not-so-humble brag you ask?
Because we run this service and research/read/talk S-curve transformations in macro and microeconomics 6 days a week for a very big reason--to make a big difference in the financial lives of our subscribers and managed account clients.
And this is DOUBLY TRUE in BEAR MARKETS because historically our macro and microeconomic investment research has paid off the most in the last three market meltdowns (ChangeWave 2000 and 2008) as well as TR going to cash ahead of the pandemic outbreak in February 2020.
Note: We are sending out renewal notices tomorrow to our SPAC Trader subscribers for whom we rolled into Transformity Investing in April 2021 when we closed the SPAC TRADER service (it was highly profitable while it lasted--but after living through many hypnotized retail speculator stock bubbles, it was clear to us the SPAC bubble--from which so MANY of us made rediculous profits--can you say $NKLA $11 to $96.50 in 35 days--had popped in April 2021 as ALL hypnotic YOLO stock manias do.
Now let me speak frankly--IF the performance above is NOT good enough for you to renew LOL--PLEASE let us know where you are getting BETTER performance, please!
Back to Crushing the SP 500 10X!
Our direct Energy E&P play in the Ultra Growth portfolio $XOP is of course crushing it this year as it did last year. But we are waiting patiently for some profit-taking in our favorite energy E&P stocks to add a much larger mix.
Why wait? BEAR MARKET TACTICS.
Remember--because energy and shipping and pipeline stocks are literally the ONLY stocks UP in value significantly in 2022 aka our DeRussiafication Commodity Complex Super Cycle stocks, bear market 101 says our big winners WILL SOON GET A 10%-20% ish sell-off on simple profit-taking.
They will be sold by hedge funds to help cover the losses/the lashing they have endured by staying too long in the zero financial gravity Growth-at-Any-Cost fever dream YOLO FOMO tech stocks created by the Fed's EVERYTHING BUBBLE 2010-2021.
Now--since a blind dog with a note tied around its neck could have crushed the SP 500 and QQQs just by reading and following our newsletter service (and I can tell you a lot of hedge funds are subscribers) I DO expect profit-taking in some of our biggest winners simply to preserve the only profits they have (unless they are an energy-focused hedge fund.)
Key Point: SO--we are patiently and tactically waiting for a pullback to under 20-day MA and hopefully to the key 50-day support to add a good mix of UN-hedged Marcellus natural gas play ($EQT $AR $RR) and Permian Basin TX low-cost EP players ($FANG $PXD $CVX $DVN $SM and few smaller players) plus a few major Canadian oil producers like $SU and $CNQ too.
Note: But in fact, the crazy profits and dividend checks we have earned from our natural gas ROYALTY trusts ($CHKR $ECTM $SJT) this year have outperformed the $XOP in 2022 by 3-5X are really "E&P" light--they have very little if any capex or risk--they just take their royalty of the TOP of the E&P company drilling and producing on our land.
I promise we will ADD a few new royalty trusts on pullbacks too as the DeRussiafy Cold War 2.0 gathers steam (Finland and Sweeden into NATO?? Wow--Switzerland next???).
Now--here is a quick synopsis of our TR Special Report "Why the TINA TECH Stock Bubble is DEAD and Why 4-5% Fed Funds Rate Will SMOTHER the US Economy in 2023" which we emailed last week and is now being updated on the Ultra Income+Growth web page.
IF you missed this TR Special report last week, PLEASE click here and take the time to read it--or print it out.
I will do one last edit over the weekend and then off to Illene our editor par excellence for syndication to other financial media sites that publish our work (like TheStreet.com, Medium el al.)
PS FEEL FREE to forward this quick summary of Macro REALITY to friends or family who can't figure out why you are not stressed out over the Nasdaq, SP 500, and Dow Jones bear markets (with over 50% of the Naz stocks down over 50% and 22% down over 70%--Dot Com Bubble anyone?)
A Public Service Message from Transformity Research on our Forecast for
US Stocks Ex-Energy Complex to DROP Another 20-40% in 2022 Due to The Immutable Laws of Financial Gravity
Dear Friends and Family,
After about 100+ questions from F&F and social media folks all basically asking “Ok smart guy—you showed me you dodged the bear market for tech stocks and have made an 80% profit killing this year on your “Commodity Super Cycle stocks” in 2022.
So tell me:
1) Is this week the “sell-off bottom” for SP 500/QQQs or
2) Are we set up for a summer market crash down -50% or more?
Well, first off of course silly person—there are no certainties in financial markets.
But Transformity Research proactively changed its investment strategy and tactics in late November when the FED via Jay Powell (“JPow”) finally admitted that elevated levels of price inflation were NOT transitory (shocking eh?).
If you were listening, they also admitted that the Fed had totally ffffed up aka “made a serious policy mistake” and needed to TOTALLY REVERSE THE LAST 11 YEARS of the Fed’s zero-gravity EVERYTHING BUBBLE aka Every High Growth Stock and Bond Gets a Trophy policy (i.e., by them creating negative real Fed Funds rates for banks to borrow at and then taking their $900 billion balance sheet up to $9 TRILLION via open market bond market purchases and buying US Treasury bonds directly from the Treasury Department- they created financial zero gravity for stocks and negative gravity aka prices for bonds).
IN short, the net effect of the Fed's Everything Bubble was the suspension of financial gravity for stocks for 11 years and the suppression of bond yields by buying 1/3 of the total US 10-year bond market (when fixed-rate bond rates go up, bond PRICES go down and vice versa)
Assets that are sensitive to rising no-risk bonds (i.e., long-duration high p/e or no p/e secular growth stocks) suddenly rose as if their valuations had been set free by financial zero gravity. Free market prices for 10-year Treasury Bond rates were suppressed 3-4X as bond values rose (which makes yield-to-maturity) go down. Bond, stocks, homes, and even made-up assets like crypto floated HIGHER ALL at the same time--that never happened before for any length of time.
But with the Fed Reversal of Policy in Dec 2021, the TR macroeconomic math today says that the Fed now has a proverbial Hobsons Choice—they are telling us they have two choices at their September Fed Monetary Policy Committee after they will have raised Fed Funds rates to 2%.
They will say publicly they will be “data dependent” and assume the “neutral rate” for Fed Funds is around 2.25% OR they will keep going on raising rates in September if core inflation has not "appreciatively declined"
Key Point: But in reality, the Fed Governors only have ONE CHOICE--keep raising rates until they CRUSH the economy and take marginal demand for goods and services and housing and rental rates DOWN into at least 2 quarters of negative GDP growth.
They have to crush the 12-year GDP expansion because most of the important inflated prices in the US economy are FIXED not variable. On the margin, only demand for housing and vehicle GDP (about 28% of the total annual US GDP) are tamped down with higher interest rates (and of course work with a 6-9 month lag).
The Fed in reality only has ONE CHOICE--they need to raise the cost of money high enough to smother the US economy enough to break the same kind of runaway price inflation feedback loop killing the finances of the 66% of American households who live paycheck to paycheck and gross $60,000 or less in household income and have $400-$600 in cash for emergencies (see Target and Walmart Q1 2022 results and 25% stock crashes).
Key Point: The talking heads on TV keep talking about how the US consumers are strong and "all have jobs if they want them and savings in the bank." But what the 25% stock meltdowns at Target and 20% at Walmart told us this week is the experts full of it--they are only talking about the top 30% of American households (who look and live like them BTW) who own 90% of the wealth in the United States and DO have strong finances and significant disposable income for discretionary spending.
And it may be shocking to you, but most of the Top 30% of American households mostly do NOT shop at Walmart or Target weekly--and certainly not for groceries staples and baby formula (we go to Costco and even THEIR stock is now down 34% from previous highs). I
n reality, the bottom 66% of American households are economically speaking what economists call "ALICE Households--Asset Light (they own 12% of the wealth in the United States), Income Constrained (paid hourly wages of weekly salaries without stock options, low or no 401k contributions and no commissions or bonuses) and Employed.
Oh...and on average they have $400-$600 of cash liquidity (and in the last two months put non-discretionary bills like gas and food and rising utility costs on their soon-to-be maxed-out credit cards--$55 billion in April alone).
These households... the vast majority of American households . . . have been in a spending recession for much of the last year as gas and food and housing and utility and healthcare costs rose faster than any wage or salary increases they could get could overcome (even with 11 million job openings for 5.5 million unemployed looking for work.)
Key point: ON the margin, is the discretionary spending by the top 30% of American households that is keeping the US economy out of recession.
As former Fed Governor and now Chief Economist of the World Banks Carmen Reinhart stated last week (and free to say what he really believes now out of the Fed) "The idea is that the Fed can engineer a painless $9 trillion/10x Historic REVERSAL of 10 years of the most historically loose monetary policy ever without sustaining substantial damage to the real economy . . .THAT idea is not based on ANY previous actual historical monetary experience."
Here is the money shot: "The history is clear--when the Federal Reserve Bank aggressively raised interest rates to tamp down runaway inflation, a SIGNIFICANT recession followed EVERY time."
Or in our nomenclature--"When the Fed removes financial asset value zero gravity and replaces it with a powerful financial asset NEGATIVE gravity (aka the 10-year no-risk bond rising from 0 percent to 3% and higher--in the financial markets the 10-year bond rate IS financial gravity), higher-risk stocks and bonds go down in value AT THE SAME TIME and the reversal of 10 years of a virtuous feed back loop of lower 10-year bond yields and rising valuations of financial assets COMES APART.
Note: Once again; there is ZERO as in NO modern financial markets or macroeconomic precedent or evidence that suggests in ANY WAY that the Fed can lower inflation by 4-5% without knocking the US economy into a major recession. The Fed is 4-for-4 in creating moderate-to-deep recessions when they were fighting runaway inflation above 3.5%.
The math does not work.
The largest contributors to CPI home prices are not coming down (YET) and rents are nowhere near coming down--lack of supply vs. actual qualified demand is at last 2X out of balance. Food prices, gasoline and diesel prices, fertilizer prices, natural gas, trucking, and ocean and air freight prices are nowhere NEAR backing up in any appreciable way.
In case you did not notice, we also entered Cold War 2.0 in February.
In this new cold war, the weapon of choice for NATO and Western democracies is to “DeRussiafy” their economies aka to take Russian energy and food and fertilizer OUT OF our economies. The other tactic du jour is to weaponize the western nations' financial system and use North American natural gas and oil AGAINST Russia.
Can you say double-barrelled ENERGY shock and food price shocks (food is a very energy-intense business at volume).
And of course, the greatest wages paid spiral feedback loop since the ’70s is now stuck in a vicious upward price spiral. With 11 million jobs for 5 million unemployed LABOR prices —and those wage increases require businesses to RAISE THEIR PRICES—and those rising prices roll into the rising cost of living, which in turn, makes labor seek and get GET higher wages which fees back into higher cost of living.
IN short, the ONLY CHOICE the Fed ACTUALLY has is to SMOTHER the real economy enough to REVERSE all the fixed elevated costs and the price hikes/wage hike labor cost spirals.
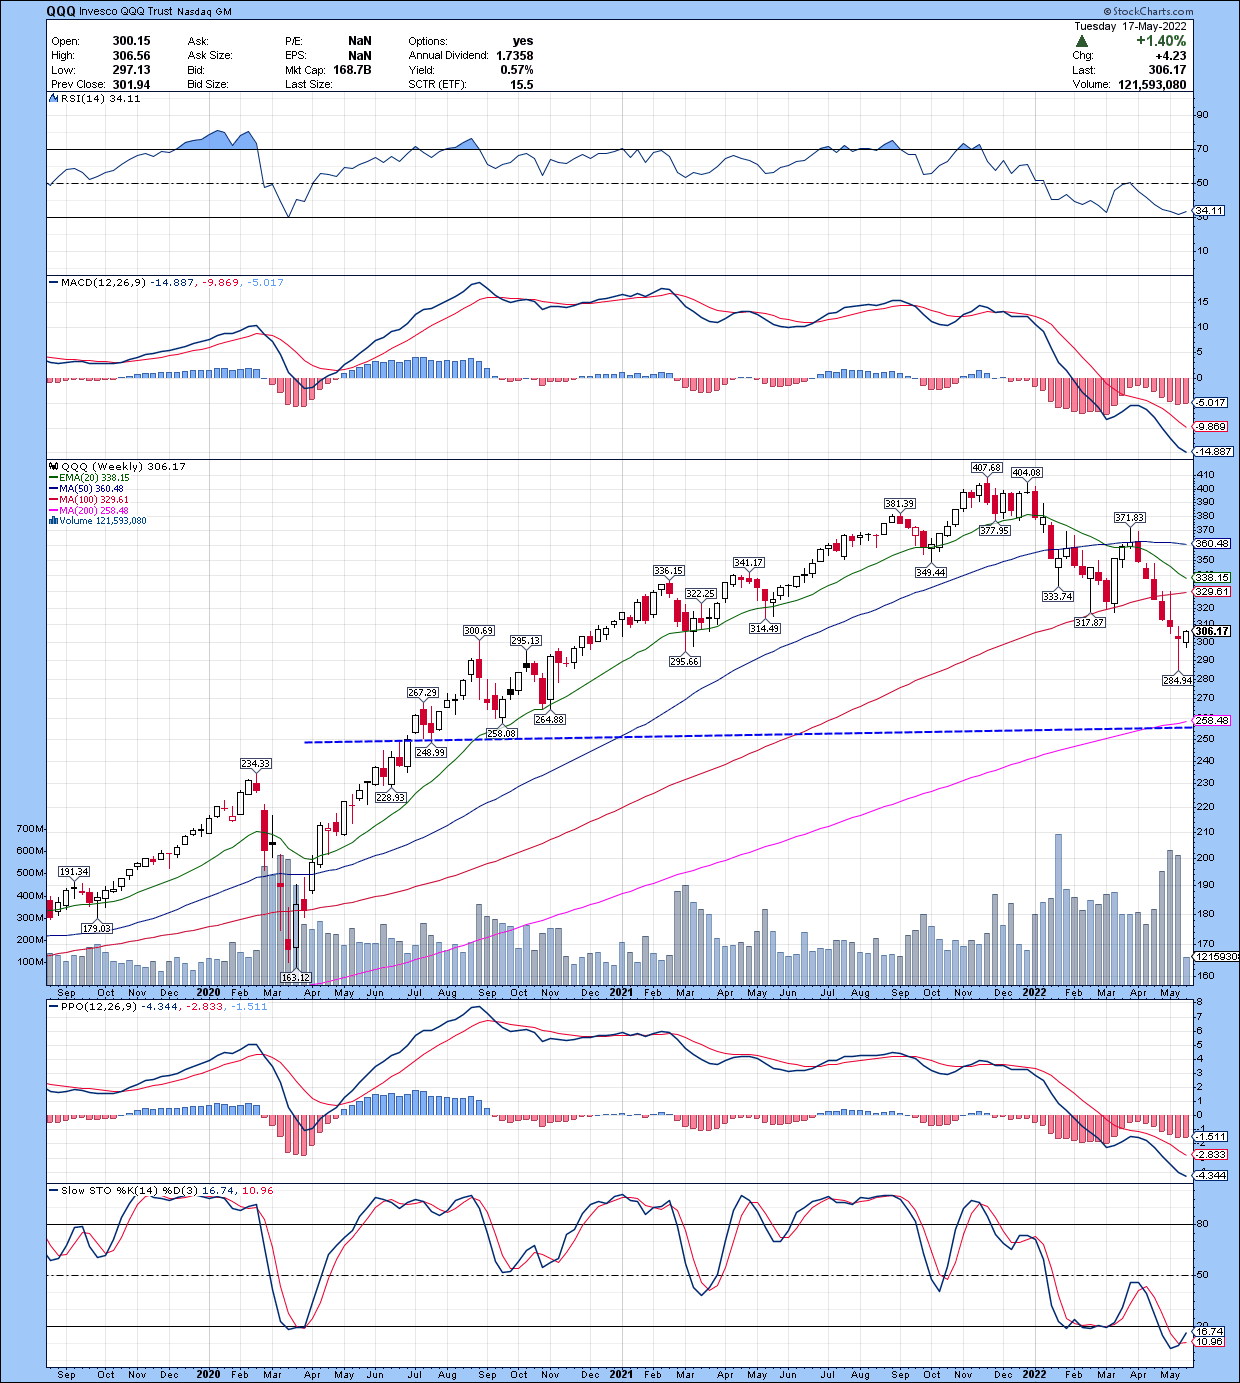
How Low Can The SP 500 and Nasdaq Index Go?
Key support in Bear Markets is the 200-WEEK support--take a look at the charts below.
Simple answer--IF the 200-week support does not hold, both indexes are 100% guaranteed to go lower..in some cases MUCH LOWER.
Why? Remember only 8 Mega Cap stocks comprise nearly 40% of the QQQ index--with Apple really holding up the entire index. And we talked about the Curse of the Market Cap Weighted Indexes--when we mean is say more of the QQQ is sold in a day than bought--the seller gets cash and the ETF SELLS stocks according to their weight in the index to raise cash to pay redemptions.
Net/Net? The higher the market cap weighting, the MORE the ETF sells its stock.
And think of this fact: in the 55% down 2008 crash, market cap indexes were only 8% of the stock market and just 2.8% in 2000.
Today market-cap-weighted index funds are 17% of the whole market but for the Nasdaq 100, the QQQs et al own 24% of the TOTAL market cap of $NDX 100 index.
KEY POINT: Today the selling of QQQ and SP 500 market-weighted index ETFs creates a self-fulfilling vicious negative feedback loop that ratchets down the HIGHEST value QQQ stocks--Apple, Microsoft, Amazon, Google, Tesla, Facebook, Nvidia, AMD--the most!
Thus the more SP 500 or QQQ index fund redemptions, the faster the indexes DROP IN VALUE.
Here is the SP 500--not much better.
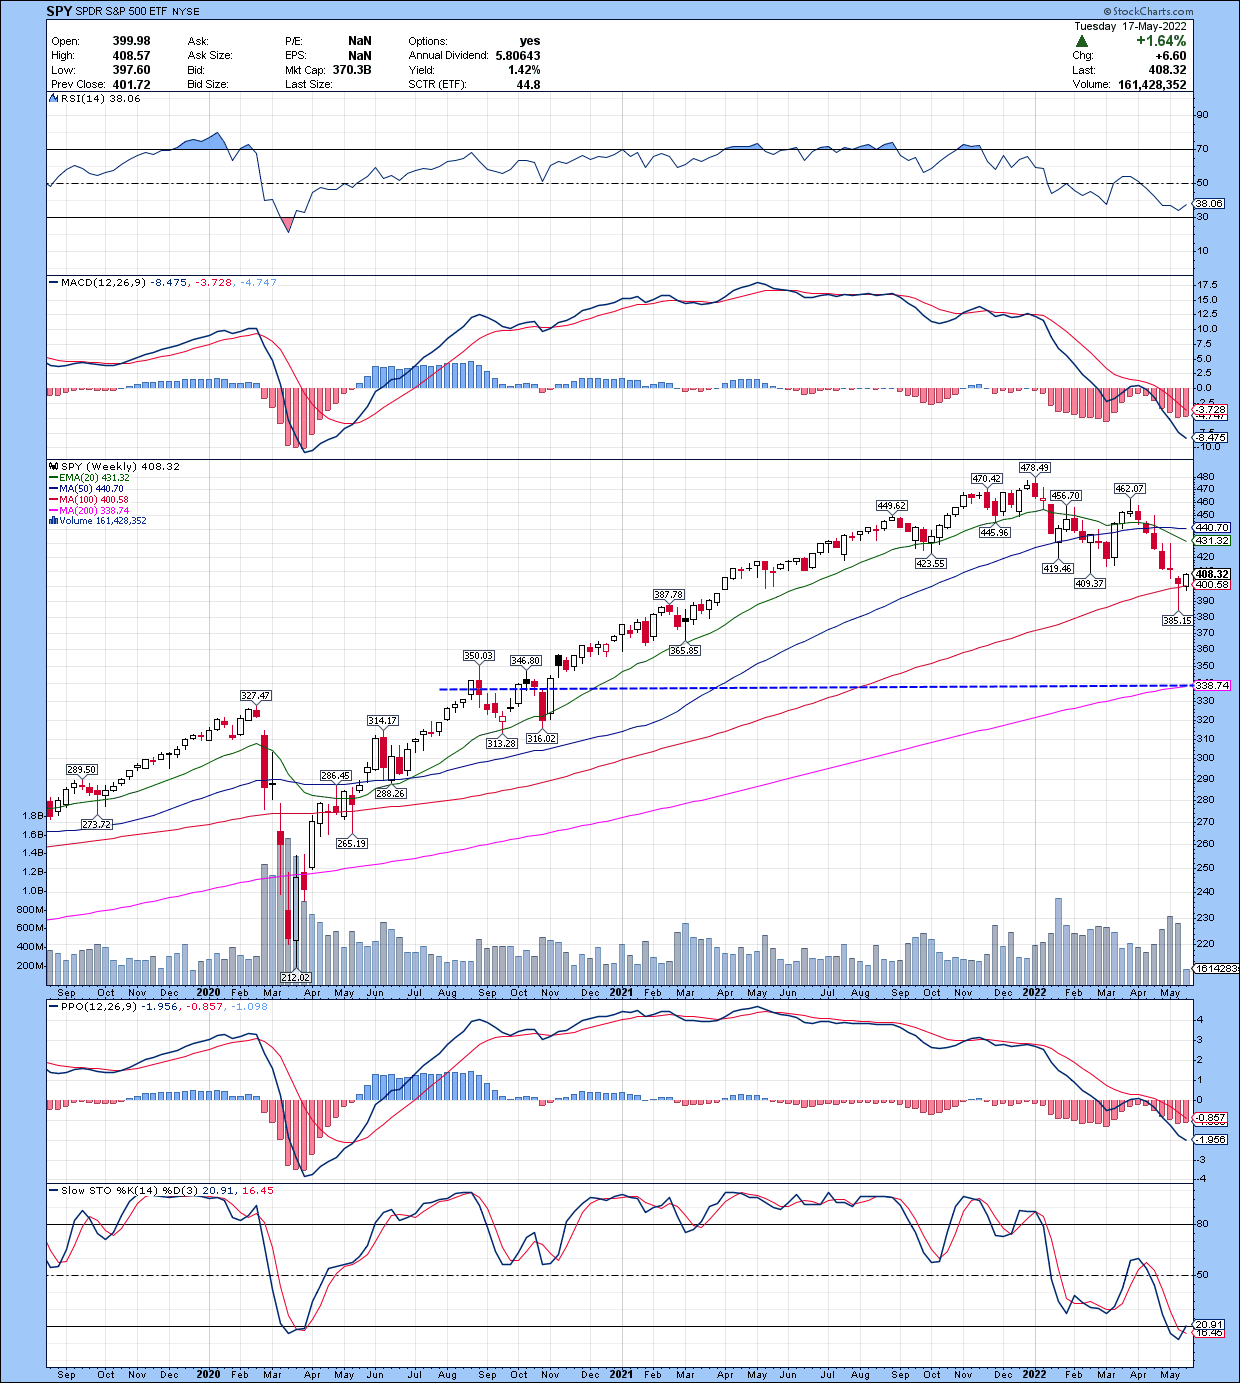
Final Point: PREPARE for the WORST during this bomb and mine-filled transition from growth-at-any-price to growth-at-a much lower prices and low p/e high income stocks going to much HIGHER valuations.
THAT is what happens when the Fed reverses the zero financial gravity of $9 trillion in cash liquidity it pumped into the financial system and suppressed interest rates in the greatest inflation of the cost of living in America in 50 years.
AND if you want to learn how to keep your retirement funds from melting away like the snowman in Frozen, invest $49 to get 6 months of the #1 performing investment buy/sell/hold newsletter in America--click here
PS: If you want to TRADE this insane volatility in Screw You Russia & Your Energy and Fertilizer and metals and steel/aluminum etc, click here, scroll down to the bottom of the registration page and join us in the All Access trading room for some historic trading profit opportunities.
PS--Ultra Income portfolio updated--thanks new guy Gary! https://transformityresearch.com/ultra-income-portfolio