
Why The REXIT Trade Reversed & What We Will Do With ALL Those Profits

Update on Your 2022 Bear Market Playbook Featuring Meltdowns to SP 3200 ish and Nasdaq 100 9000 ish (with multiple 10%+ "rip-your-face-off" bear market short-covering rallies, too)
Hey Subscriber,
Well...sitting on about 85% cash as a result of our tight REXIT EXIT June 10 sell stops hit on June 10 looks REALLY good from where I and my money management clients up 72% ish in 2022 sit on June 23.
Note: When any stock or sector goes ballistically HIGHER at the same time major indexes are tanking--THAT IS CRAZY--and you must deploy tight sell stops!!
Key point: When we shared with you last week about how giant momentum funds had blown INTO and then OUT of our favorite REXIT and energy stocks, I did not have real numbers to access the magnitude.
I do now--and the numbers are ginormous.
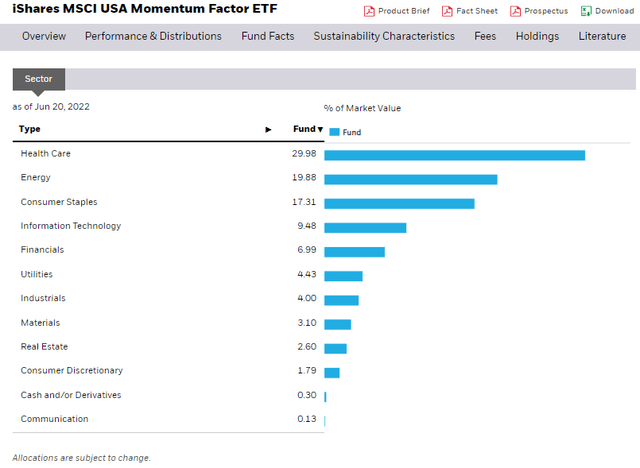
We got a VERY interesting note yesterday from our Goldman Sachs trading desk on how the giant $MTUM ETF's entry into REXIT energy beneficiaries on their early May rebalance exploded our REXIT stocks "to the moon" too far and too fast.
Understand this: the "price momentum factor" is very simple--it identifies which stocks are moving up in value faster than the overall market in various timeframes (weekly/monthly/quarterly or 20-day/50-day price moving averages).
Hundreds of hedge funds and CTAs run exclusively on price momentum algorithms aka "black box" investing. $MTUM is also a proxy for hundreds of $billions in price momentum hedge funds and pension funds--with many hedge funds highly leveraged. And they have worked for 12 years in a row.
SO--in the first week of May, the $MTUM rebalance went from a 7.2% energy weight to nearly 20%--in a week!
hen--when out of the blue
A) the Freeport McMoran LNG plant suddenly shut down stranding billions of cubic feet of nat gas in US storage tanks
B) The US Fed raised the Fed Funds rate by 3/4% aka 75 bps and the Fed Funds futures priced in another 1.5% by the September meeting with JayPow telling Congress "We will keep raising rates until the inflation data tells us to stop"
C) Global Central Banks (and even Switzerland!) jumped on the "Whip Inflation Now" bandwagon (for example the UK is forecasting 11% inflation in June--blimey!) and boom
1) US natural gas prices CRASHED and
2) The reality of a global Federal Reserve bank-led global recessions in all the modern Western countries got very real very fast and
3) An 8% reduction in US gasoline sales was reported in mid-June that screamed "oil demand destruction"
and then BOOM AGAIN--the MoMo money blew out of energy as fast as it rushed in.
This early May to mid-June chart of our energy producer proxy $XOP tells the entire 30-day MOMO BOOM BUST story which is simple: WHEN the nat gas and oil prices tanked, $XOP price momentum reversed and the bottom fell out of the REXIT stocks.
Why the massive reversal?
A) Because virtually all momentum formulas and algorithms use a blend of "what's working now" 10-20-day and 50-day moving averages as their automatic sell stops and
B) with those support levels broken
C) The MoMo funds that had become the marginal BUYER (the price-insensitive buyer) became the marginal SELLER of oil and gas exploration stocks with TIGHT 20-day MA sell stops.
This chart tells the whole story.

Key Point: THAT IS WHY WE ADVISED TIGHT 8% SELL STOPS from the June highs on June 10-- the whole move was too much--too exponential and ballistic--which was the same issue with our tight sell stops on $ECTM and $SJT--quiet little energy trusts doubling in price in a month??
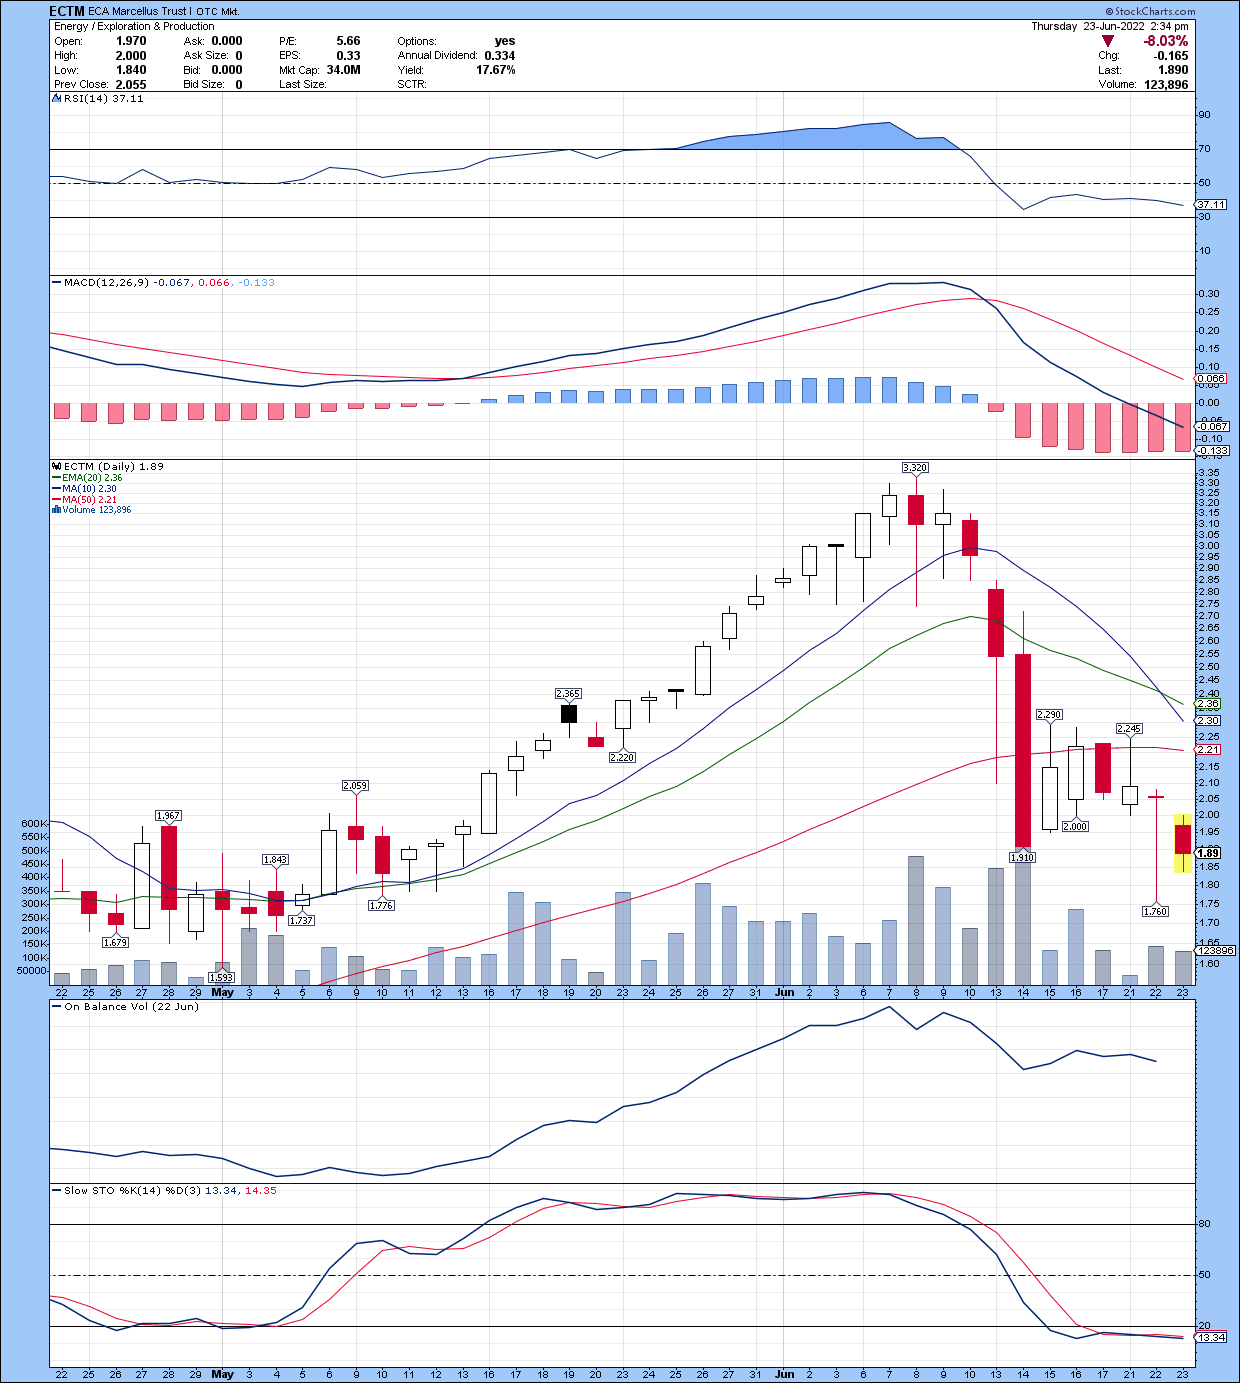
I have been investing in secular growth sectors for 30+ years...and this exponential ramp in the REXIT play prices was an obvious Momo move...and the "viagra" chart meant we should tighten sell stops and we did.
When are they attractive again?
As we mentioned in last update--we will be nibbling at 50-week support and inhaling at 100 WEEK levels--and we are in the process of adding those levels into our Buy Under prices as the REXIT trade is NOT over--it's just that the momo money injection gave us 7 YEARS of wealth building in about 6 months.
You know the saying about the stock market: "Hogs Get Slaughtered!"
Add this one from me: "I am ALLERGIC to GIVING BACK STUPID QUICK PROFITS by waiting to "sell the top."
You NEVER sell the top (ok on $ECTM $SJT $PBT we did!) and when you do (Like selling $NKLA at $94!) consider yourself lucky and not that good.
Remember: Automated sell stops (that move up every day to say 6% under that closing price of the former day) do ALL the work for you while you let the MARKET price action take you out of your position.
Building our Secular Ultra Growth High Cash Flow Dumpster Diving List
We are building our Dumpster Diving Enterprise and Consumer technology platforms hitting new lows--The Enterprise SaaS list of 80% gross margin/25% CAGR/25 p/e now includes the following tickers (which I would load into your favorite portfolio tracker--mine are Seeking Alpha or Yahoo Finance).
$VEEV $ZS $DDOG $OKTA $ADSK $SNOW $SPLK $COUP $AVLR $GTLB $TWLO $DOMO $BRZE $U $BRZE $AYX BAND $DXCM $ESTC
Same idea--biting at 50-week/gulping at 100 weeks levels.
UPDATE: Market Murderers Row of the Gale Force Headwinds AS we patiently wait for the final market PUKE (40+ VIX and Historic Weekly Volume)
With the Fed's Everything Bubble more than halfway to becoming fully demolished, the US and Global GDP and EPS headwinds are still pretty stunning when you add them all up as we roll our of earnings quiet period and into the mid-July earnings and forward guidance season kicks-off after the 4th of July
1) US recession by our math ALREADY in a mild recession (and June 27 GDP NOW index should prove)
2) Massive Global Central Bank tightening Ex-Japan raising odds of EU recession to about 100%
3) A 250% higher cost of the capital based on the US prime lending rate
4) Salary and Wage spiral slowing but very sticky
5) Layoffs start to bite in ALL the industries that OVER hired into the pandemic
6) General recession cost-cutting and lower UNIT sales volumes from HIGHer prices = LOWer margins
7) Historically HIGH $dollar vs. Yen and EU and pound makes US exports and energy cost more
8) Repatriating foreign currency sales into $dollar cuts the gross margins
9) Discretionary durable goods sales fall as life essentials costs rise
10) Bottom 60% of US households ie <$65k gross income and 40% of households that do not own their home have no savings to fall back on and are now putting essential spending on credit cards
11) 2 months of Leading GDP Indicators down another 0.4%
12) $16 TRILLION of wealth has now gone to money heaven (stocks, bonds, crypto and equity lost in homes purchased in the last 24 months) aka a MONSTER Negative Wealth Effect on discretionary spending by the top 70% of households ranked by income
13) The endless Ukraine war
14) The upcoming Q3 Negative Earnings Revisions and Lower Price Targets
15) Over 7% CPI prints through the summer because the big inflation factors are not going appreciably lower
BUT NOW we have added another squadron of GDP drags/EPS drags to the list
16) It now appears by Fed futures that the "Fed Put" aka stock market bailout is lowered to a 50% crash--30% is not enough
17) Retail bankruptcies are about to hit a perfect storm of higher inflation-based rent increases and hourly wage spiral
18) Reverse Wealth Effect: Many analysts now roughly calculate that every 10% decline in SP 500 plus 1% gain in 10 Year Treasuries = 1% LOWER GDP growth
19) NFIB surveys of small businesses say 72% have raised prices while their 6-month forward outlook for a stronger economy hit record lows
20) The spread between High Yield corporate bonds vs. US Treasuries has widened more than 2% which is a leading indicator of rising default rates of lower-quality corporate debt
21) Soaring gasoline prices have gas station sales down for the 14th consecutive week which means LESS consumer wallet share for discretionary purchases
22) Russians are now attacking grain and corn exports from Ukraine and restricting shipping
23) Shipping rates from China are now down 35% from the start of the year--negative for container shipping profits
24) Apple--largest market-cap-weighted stock in SP 500-- is still at a 21 p/e or a 38% premium to the SP 500 stocks--and they only have 10% recurring revenues (i.e., vulnerable to consumer spending pullback + pandemic pull forward sales).
25) You don't micro-manage 8% inflation with a pick ax--you have to use a sledgehammer and JayPow just re-promised to do just that until the inflation genie is back in the proverbial bottle
26) Coast to Coast’ Housing Correction Is Coming, Says Moody’s Chief Economist aka a Housing Bust with 6%+ mortgage rates
27) "Soft Landings Are a Myth When the Fed is Tightening 400bps into a Rapidly slowing economy" or as Larry Summers points out (who has been dead right on his inflation calls) "When you have unemployment UNDER 4% and inflation ABOVE 4% within 18-24 months recessions have ALWAYS 100% of the time occurred because the economy is going to HAVE TO create significant SLACK in unemployment and GDP growth to bring inflation down to acceptable levels.
28) US Industrial Output has downshifted sharply in May and June
29) The Fed has ALWAYS had to raise rates ABOVE the underlying inflation rate to break the inflation cycle--and that means a 4-5% 10-year terminal rate that is CLEARY above the GDP "neutral rate."
and finally
30) The stock market re-rating at 25-35% lower values is Wall Street and FOMO YOLO cell phone trader's sobering realization that the QT/ZIRP decade+ era of phase of super-easy money and always buying "the Dip" that supercharged stock prices 2x higher than normal is over and that 30-50% of that equity value PULL FORWARD now has to be pulled back (and as always will overshoot on the way down as on the way up).
My Message to our subscribers and managed account clients?
1) No one calls the exact bottom of a bull market --but I have been on the record VERY CLOSE in 2003/2008 and of course April 2020.
2) The magnitude of the multi-$trillion UNWIND of the Fed's historic QT/ZIRP/Everything Bubble era has to be highly correlated to the magnitude of the 12-year windup of the Everything Bubble era.
3) The 50-100 week support lines still look like the profitable re-entry points
4) This bear market does NOT END until the Fed is done raising rates
5) And as noted above, Fed Funds rates HAVE TO go above the PCE inflation rate to create enough slack in demand
6) To give us ANOTHER historic opportunity to earn 200-300%+ returns on the economic recovery
NET NET the path of least resistance is still DOWN for overall market indexes UNTIL FED STOPS HIKING RATES with rip-your-face-off short-covering rallies
Here are the links explaining our path to our bear market forecast to click again:
1) TR's 2023 Recession Base Case: Why The Fed's "Immaculate Monetary Tightening" aka Soft Landing Narrative Is Mathematically Impossible
2) TR's 2022 $SP 500 DOWN 35%-40%/Nasdaq100 DOWN 50%+ Bear Market Case: Why The 2002-2023 Bear Market for > 16+ P/E Stocks Is a 100% Certainty
Toby